If you are asking about a problem you are experiencing, please use the following template, as it will help us help you. If you have a different problem, please delete all of this text 
Kibana version:
7.7
Elasticsearch version:
7.7
APM Server version:
7.7
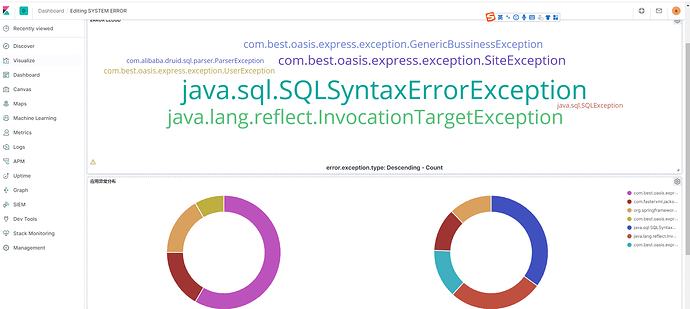
I create a dashboard about the system error , there are some visualization in the dashboard.
what should I do if I want to click the exception ,the page will redirect to the apm page to show the exception trace detail
