Can Kibana group events around a common id and perform statistics on the group, then plot it?

I usually use Kibana (as a basic user) with a flow of independent timed events. I then make some graphs on the evolution or statistics of a population in a specific timeframe.

I now face a problem I do not know how to approach: a set of timed events, but with a common identifier and a common date that groups them into clusters and I would like to make statistics on these clusters.

To take an example, consider the following set of data ("some date" is a random date)

[
    {
        "id": 1,
        "age": 20,
        "nice": true,
        "sent": "date1"
    },
    {
        "id": 1,
        "age": 25,
        "nice": false,
        "sent": "date1"
    },
    {
        "id": 2,
        "age": 20,
        "nice": false,
        "sent": "date2"
    },
    {
        "id": 2,
        "age": 30,
        "nice": false,
        "sent": "date2"
    }
]

My goal is to have an evolution of the average of "nice" people by id (or by sent). This requires to first group the data by id, then to calculate the average by group, and then to plot this average over time (the group is located at sent).

Is Kibana able to do something like that?

My backup plan is to mak the calculations upstream and sent the results to Kibana but I would like to avoid this because I may want to show some other statistics (say, the median instead of the average - this will require all data to be updated in Kibana from the upstream backend)
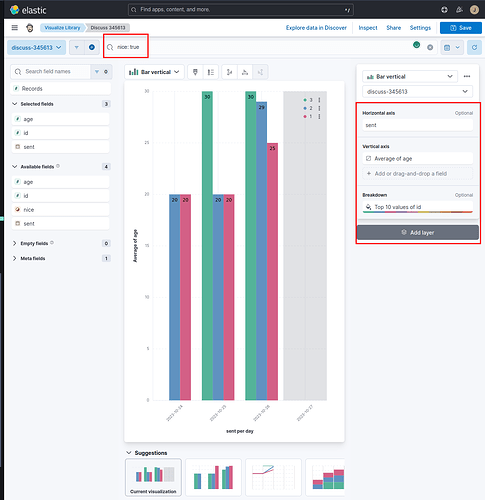
In Lens you can break your chart by id and chart over time (sent) any metric (median, average, etc) and include filters to only render the data you want.

I've created an index and the associated Data View with some data following your spec:

DELETE discuss-345613

PUT discuss-345613
{
  "mappings": {
    "properties": {
      "id": {"type": "keyword"},
      "age": {"type": "integer"},
      "nice": {"type": "boolean"},
      "sent": {"type": "date"}
    }
  }
}

# 10-24
POST discuss-345613/_bulk
{ "index": {} }
{ "id": 1, "age": 20, "nice": true, "sent": "2023-10-24"}
{ "index": {} }
{ "id": 1, "age": 25, "nice": false, "sent": "2023-10-24"}
{ "index": {} }
{ "id": 2, "age": 20, "nice": true, "sent": "2023-10-24"}
{ "index": {} }


# 10-25
POST discuss-345613/_bulk
{ "index": {} }
{ "id": 1, "age": 20, "nice": true, "sent": "2023-10-25"}
{ "index": {} }
{ "id": 1, "age": 30, "nice": false, "sent": "2023-10-25"}
{ "index": {} }
{ "id": 2, "age": 20, "nice": true, "sent": "2023-10-25"}
{ "index": {} }
{ "id": 2, "age": 30, "nice": false, "sent": "2023-10-25"}
{ "index": {} }
{ "id": 3, "age": 30, "nice": true, "sent": "2023-10-25"}

# 10-26
POST discuss-345613/_bulk
{ "index": {} }
{ "id":1, "age": 25, "nice": true, "sent": "2023-10-26"}
{ "index": {} }
{ "id": 2, "age": 35, "nice": true, "sent": "2023-10-26"}
{ "index": {} }
{ "id":2, "age": 23, "nice": true, "sent": "2023-10-26"}
{ "index": {} }
{ "id": 3, "age": 35, "nice": true, "sent": "2023-10-26"}
{ "index": {} }
{ "id":3, "age": 20, "nice": true, "sent": "2023-10-26"}
{ "index": {} }
{ "id": 3, "age": 35, "nice": true, "sent": "2023-10-26"}

# Data view using sent as time field
POST kbn:/api/data_views/data_view
{
  "data_view": {
    "title": "discuss-345613",
    "timeFieldName": "sent"
  }
}

Then, in Lens, it is straightforward to add a filter for nice: true and a breakdown for the top 10 values of id (you can also use intervals or any other filter).

This topic was automatically closed 28 days after the last reply. New replies are no longer allowed.