Hi, I currently have a scripted field that is calculating total CPU percentage used while accounting for number of cores from metricbeat. Below is the setup for the scripted field.

This works as expected, and shows up in Discover as shown below:
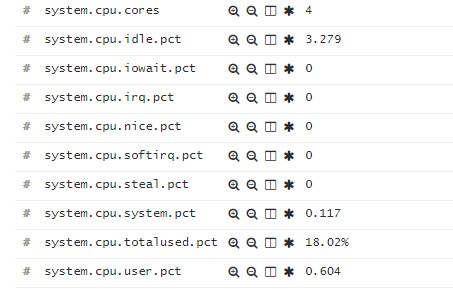
I can even visualize it by selecting the field on the left from the discover tab and clicking Visualize:

Which results in this:

However, once I switch the aggregation to be Max on the field and to use a Date Histogram vice a term, the visualiztion goes blank:
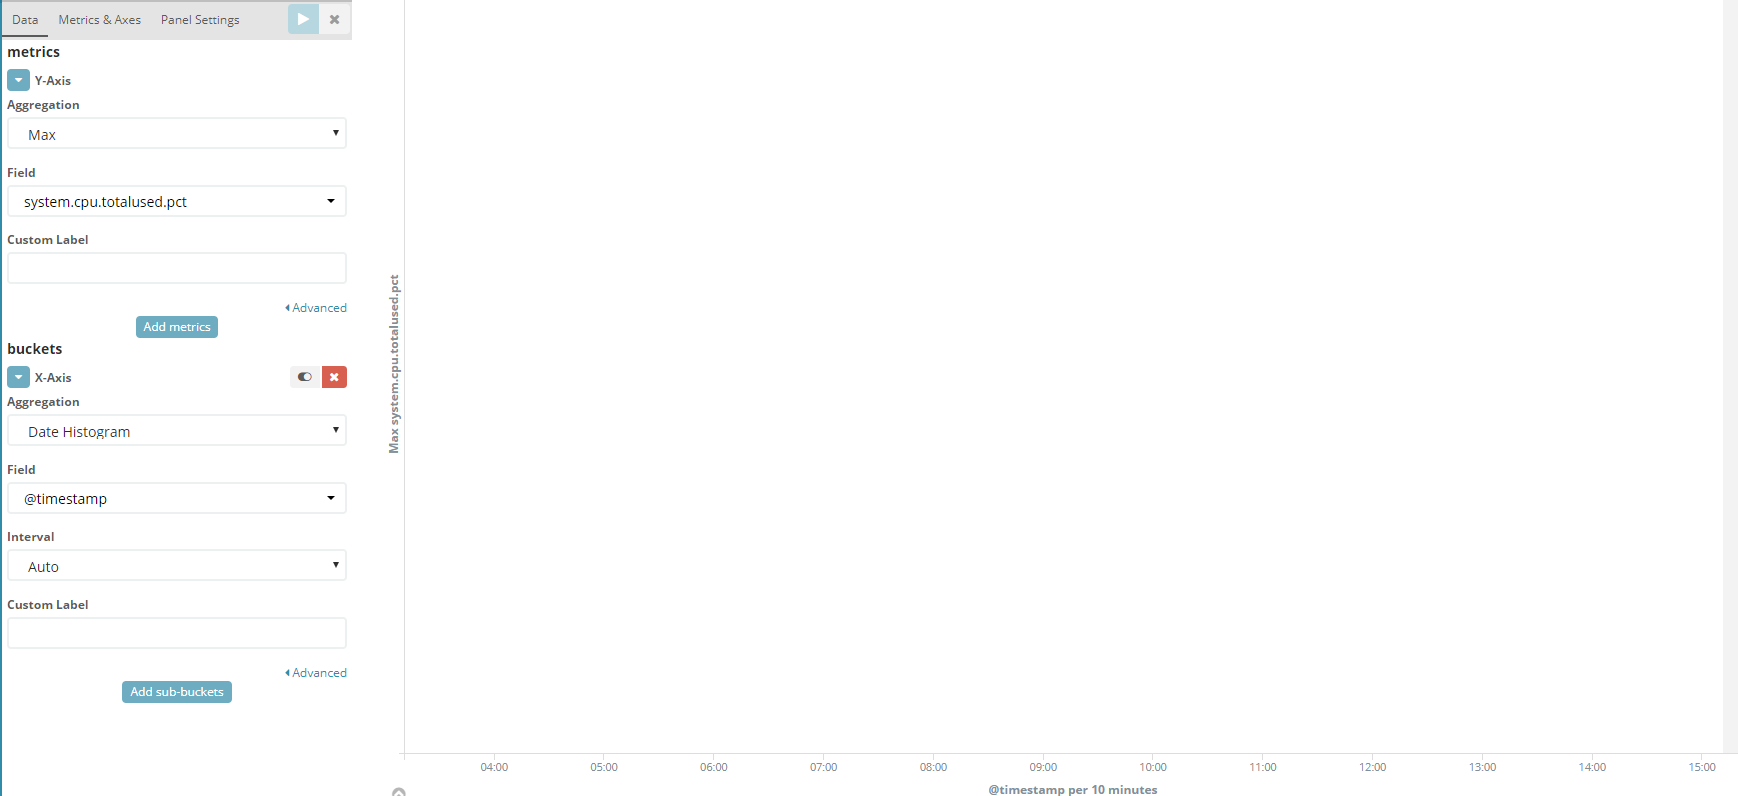
This would be a handy thing to be able to do for some dashboards I'm putting together at the request of my boss, but I can't figure it out.