I figure out the issue. There's a problem in Canvas where it doesn't handle field names with spaces correctly. I'll get a fix in, and hopefully ship it in the next version.
In the meantime, you can use alterColumn to rename the column, like so:
filters | esdocs index="wbs*"
| alterColumn "activity month" name=activity_month
| pointseries x=activity_month y="sum(total_activity_hours)" color="hml"
| plot defaultStyle={seriesStyle points=5}
| render
You can see the issue if you break the expression down:

Here, I've split up each of the parts of the expression, starting with the data, then just the pointseries, and finally the whole thing with plot. Notice how the column for the pointseries output has a question mark. This means that it doesn't know what type of data is in there, and when plot tries to use it, it ends up treating the value as a number, resulting in 0... kind of.
When you rename the column you get a different outcome:

With the space removed from the column name, pointseries now correctly assigns the output type as a string, and plot knows how to correctly handle the data.
You can go even further and cast the value into an actual month name, using mapColumn:
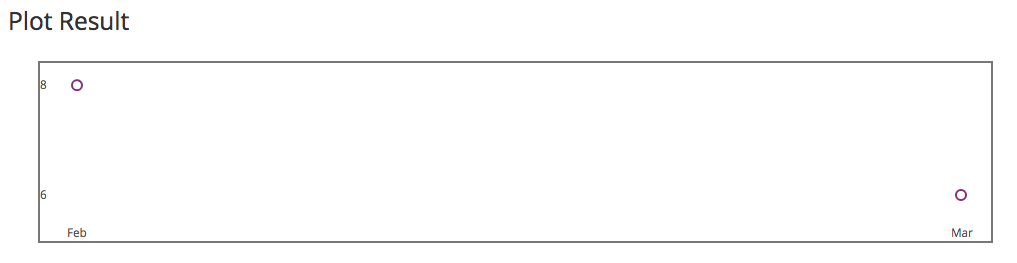
filters | esdocs index="wbs*"
| alterColumn "activity month" name=activity_month
| mapColumn activity_month expression=${getCell activity_month | formatdate "MMM"}
| pointseries x=activity_month y="sum(total_activity_hours)" color="hml"
| plot defaultStyle={seriesStyle points=5}
| render
Hope that's all helpful!