Some of the Kibana visualizations for Metricbeats appear to have a typo that prevent the color ranges from rendering properly. Basically the word "operator" is spelled "opperator" in the .json files that generate the visualizations. I can open an issue and submit a PR if someone agrees this is an issue.
Thank you for your message. It's true that it seems awkward and I have checked that we also have the term opperator in the haproxy and system dashboard so I'm not sure if this is intentional.
I have tried to rebuild the dashboard with the typo corrected but I haven't seen any color range in any of the bar charts (as I was expecting)
I'll move this to the Kibana board to see if they can help with this issue
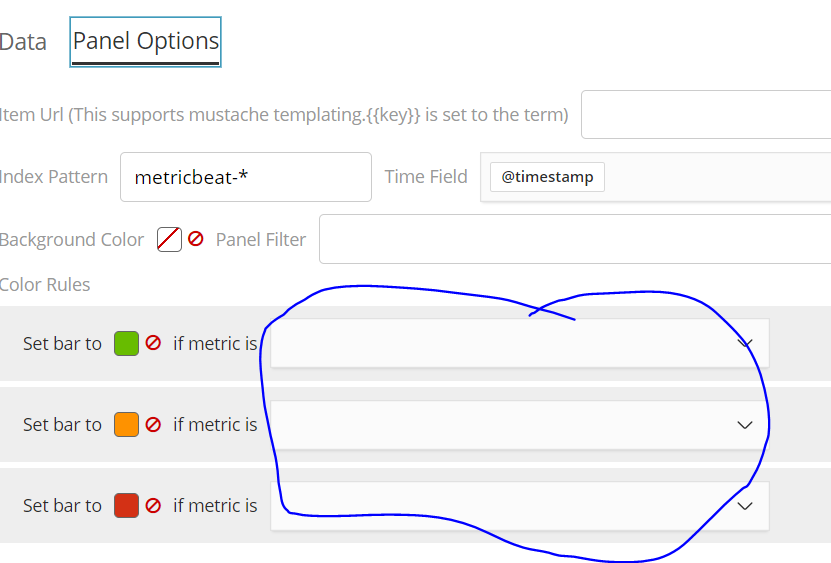
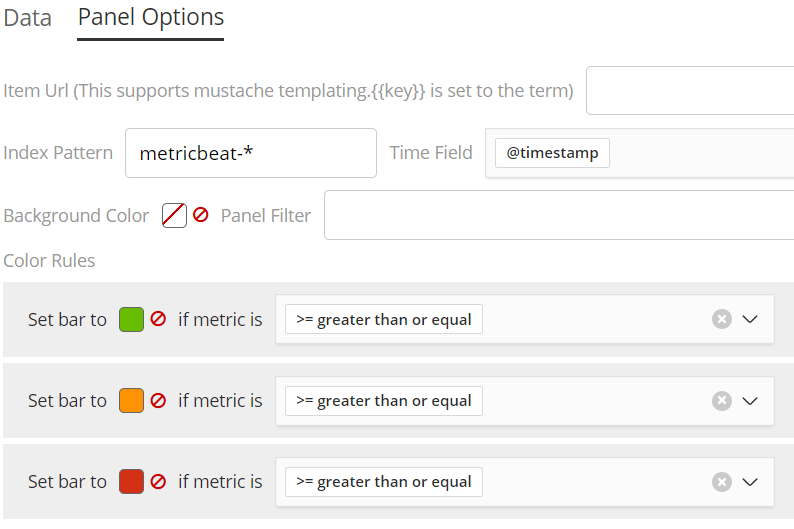
Thank you for taking a look, @Mario_Castro. If you use the visualization editor in Kibana and look at the panel options for the visualizations that use "opperator", you'll see that the dropdowns are blank, if you change "opperator" to "operator" and reload them, I believe they will say ">= greater than or equal". Screenshots attached below.
Apache, Apache Lucene, Apache Hadoop, Hadoop, HDFS and the yellow elephant
logo are trademarks of the
Apache Software Foundation
in the United States and/or other countries.