Kibana custom dashboard does not show Filebeat metrics values

Hi,

Summary of the Issue I'm having:
Custom Kibana dashboard I have created to show a few internal Filebeat metrics - does not show their values (just shows zeros for all fields I selected), even though I can see that the corresponding fields in the metrics events , in the .monitoring-beats-* indices - do have non-zero values

Now the details:
After I finally got all Filebeat metrics successfully flowing into ES for monitoring ( see this post for the whole story and the final setup: Filebeat monitoring metrics are "dropped" when a GEOIP pipeline is used - #24 by ppine7 ) - I now tried to show some of those metrics in Kibana dashboards...

There is an already pre-build Kibana dashboard for Beats monitoring - which works good and I can see data there - but it only includes few main metrics. I wanted to add many more internal Filebeat metrics to help me troubleshoot some high load failure scenarios ...

So, after reading about how to build a custom Dashboard with Filebeat metrics here: Building Your Own Beat Dashboards | Beats Developer Guide [master] | Elastic I did the following:

  1. verified I actually see those metrics I am interested in in the .monitoring-beat-* indices... I am interested in all libbeat.output metrics - to see events delivery and failure statistics . Here is an example query I used to find metrics events that have one of those fields non-zero:
GET .monitoring-beats-*/_search
{
  "query": {
    "range": {
      "beats_stats.metrics.libbeat.output.events.total": {
        "gt": 100
      }
    }
  }
}

Since I ran a few load tests through Filebeat - I have ingested about 200K events into ES - there were bound to be metrics like that with non-zero values. And indeed, here is an example result with event like this:

{
  "took": 601,
  "timed_out": false,
  "_shards": {
    "total": 3,
    "successful": 3,
    "skipped": 0,
    "failed": 0
  },
  "hits": {
    "total": {
      "value": 38,
      "relation": "eq"
    },
    "max_score": 1,
    "hits": [
      {
        "_index": ".monitoring-beats-7-2022.10.27",
        "_id": "yWVVGoQBSGDuCsueuARX",
        "_score": 1,
        "_source": {
          "timestamp": "2022-10-27T16:45:35.951Z",
          "type": "beats_stats",
          "beats_stats": {
            "beat": {
              "uuid": "xxx555a",
              "type": "filebeat",
              "version": "8.4.3",
              "name": "mac-lt2-mpopova",
              "host": "mac-lt2-mpopova"
            },
            "metrics": {
              "beat": {
                "memstats": {
                  "gc_next": 43085040,
                  "rss": 80461824,
                  "memory_total": 2012057416,
                  "memory_alloc": 29517288,
                  "memory_sys": 70534152
                },
                "cpu": {
                  "user": {
                    "time": {
                      "ms": 15264
                    },
                    "ticks": 15264
                  },
                  "system": {
                    "ticks": 17221,
                    "time": {
                      "ms": 17221
                    }
                  },
                  "total": {
                    "value": 32485,
                    "ticks": 32485,
                    "time": {
                      "ms": 32485
                    }
                  }
                },
                "runtime": {
                  "goroutines": 74
                },
                "info": {
                  "uptime": {
                    "ms": 7800436
                  },
                  "ephemeral_id": "f70356f0-001c-4fd6-8437-d8f5d91bf54c",
                  "name": "filebeat",
                  "version": "8.4.3"
                }
              },
              "system": {
                "cpu": {
                  "cores": 16
                },
                "load": {
                  "1": 3.1538,
                  "5": 2.9277,
                  "15": 2.5811,
                  "norm": {
                    "1": 0.1971,
                    "5": 0.183,
                    "15": 0.1613
                  }
                }
              },
              "registrar": {
                "states": {
                  "update": 0,
                  "cleanup": 0,
                  "current": 0
                },
                "writes": {
                  "success": 0,
                  "total": 0,
                  "fail": 0
                }
              },
              "filebeat": {
                "harvester": {
                  "started": 0,
                  "closed": 0,
                  "running": 0,
                  "open_files": 0,
                  "skipped": 0
                },
                "input": {
                  "log": {
                    "files": {
                      "truncated": 0,
                      "renamed": 0
                    }
                  },
                  "netflow": {
                    "flows": 0,
                    "packets": {
                      "dropped": 0,
                      "received": 0
                    }
                  }
                },
                "events": {
                  "active": 100,
                  "added": 10021,
                  "done": 9921
                }
              },
              "libbeat": {
                "config": {
                  "reloads": 0,
                  "module": {
                    "starts": 0,
                    "stops": 0,
                    "running": 0
                  },
                  "scans": 0
                },
                "output": {
                  "write": {
                    "bytes": 15764310,
                    "errors": 0
                  },
                  "read": {
                    "errors": 2,
                    "bytes": 145205
                  },
                  "type": "elasticsearch",
                  "events": {
                    "failed": 0,
                    "dropped": 0,
                    "duplicates": 0,
                    "active": 50,
                    "toomany": 0,
                    "batches": 205,
                    "total": 9971,
                    "acked": 9921
                  }
                },
                "pipeline": {
                  "clients": 1,
                  "events": {
                    "published": 10021,
                    "failed": 0,
                    "dropped": 0,
                    "retry": 1,
                    "active": 100,
                    "total": 10021,
                    "filtered": 0
                  },
                  "queue": {
                    "acked": 9921,
                    "max_events": 4096
                  }
                }
              }
            },
            "timestamp": "2022-10-27T16:45:35.951Z"
          },
          "interval_ms": 10000,
          "cluster_uuid": "053kEhnTTqegfUyicL3J8g"
        }
      },

especially interesting (to me) are the metrics I was looking for in the libbeat.output section:

"libbeat": {
                "config": {
                  "reloads": 0,
                  "module": {
                    "starts": 0,
                    "stops": 0,
                    "running": 0
                  },
                  "scans": 0
                },
                "output": {
                  "write": {
                    "bytes": 15764310,
                    "errors": 0
                  },
                  "read": {
                    "errors": 2,
                    "bytes": 145205
                  },
                  "type": "elasticsearch",
                  "events": {
                    "failed": 0,
                    "dropped": 0,
                    "duplicates": 0,
                    "active": 50,
                    "toomany": 0,
                    "batches": 205,
                    "total": 9971,
                    "acked": 9921
                  }
                }
  1. to visualize these libbeats metrics, I have created a new Data View (what used to be an index pattern in 7.x ES version):

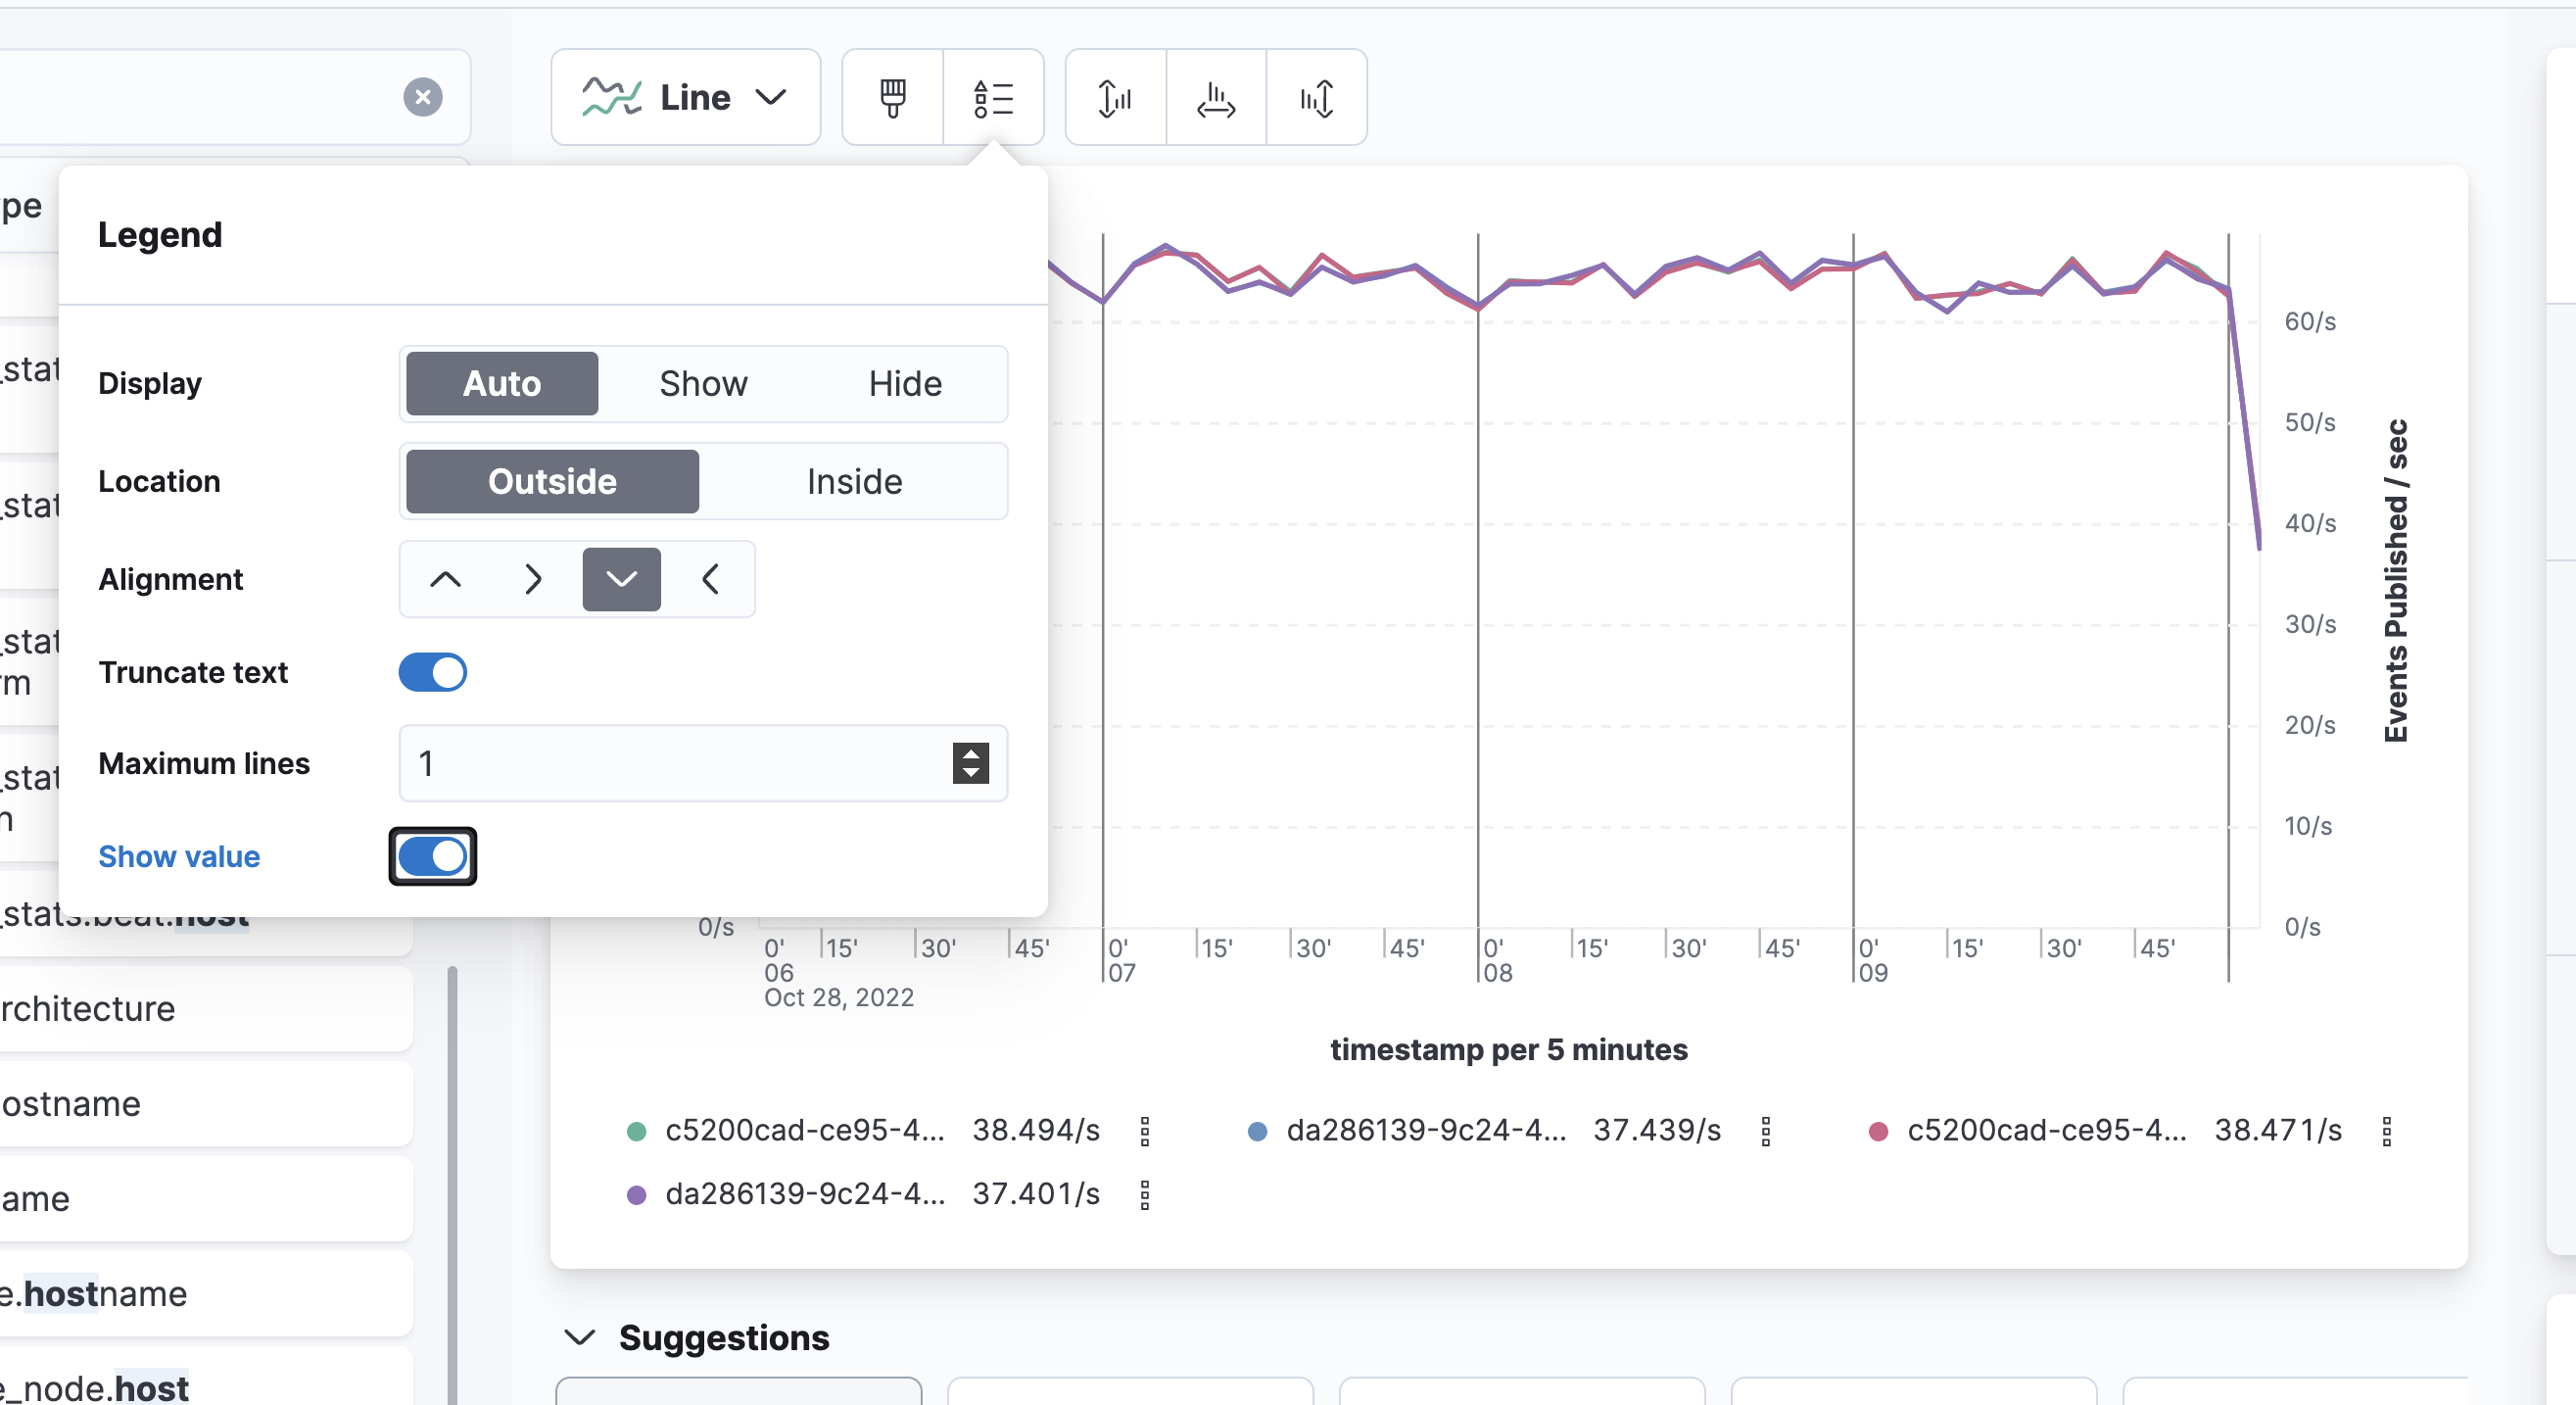
  2. and created a new Dashboard using this Data View. Here is an example of one visualization that is trying to show Suns of some of the "libbeat.output.xxx" metrics:

  3. then I ran a few more load tests, making sure Fielbeat was busy sending data into ES. And still my new Dashboard does not show any data for those metrics - all values/sums are zeros:

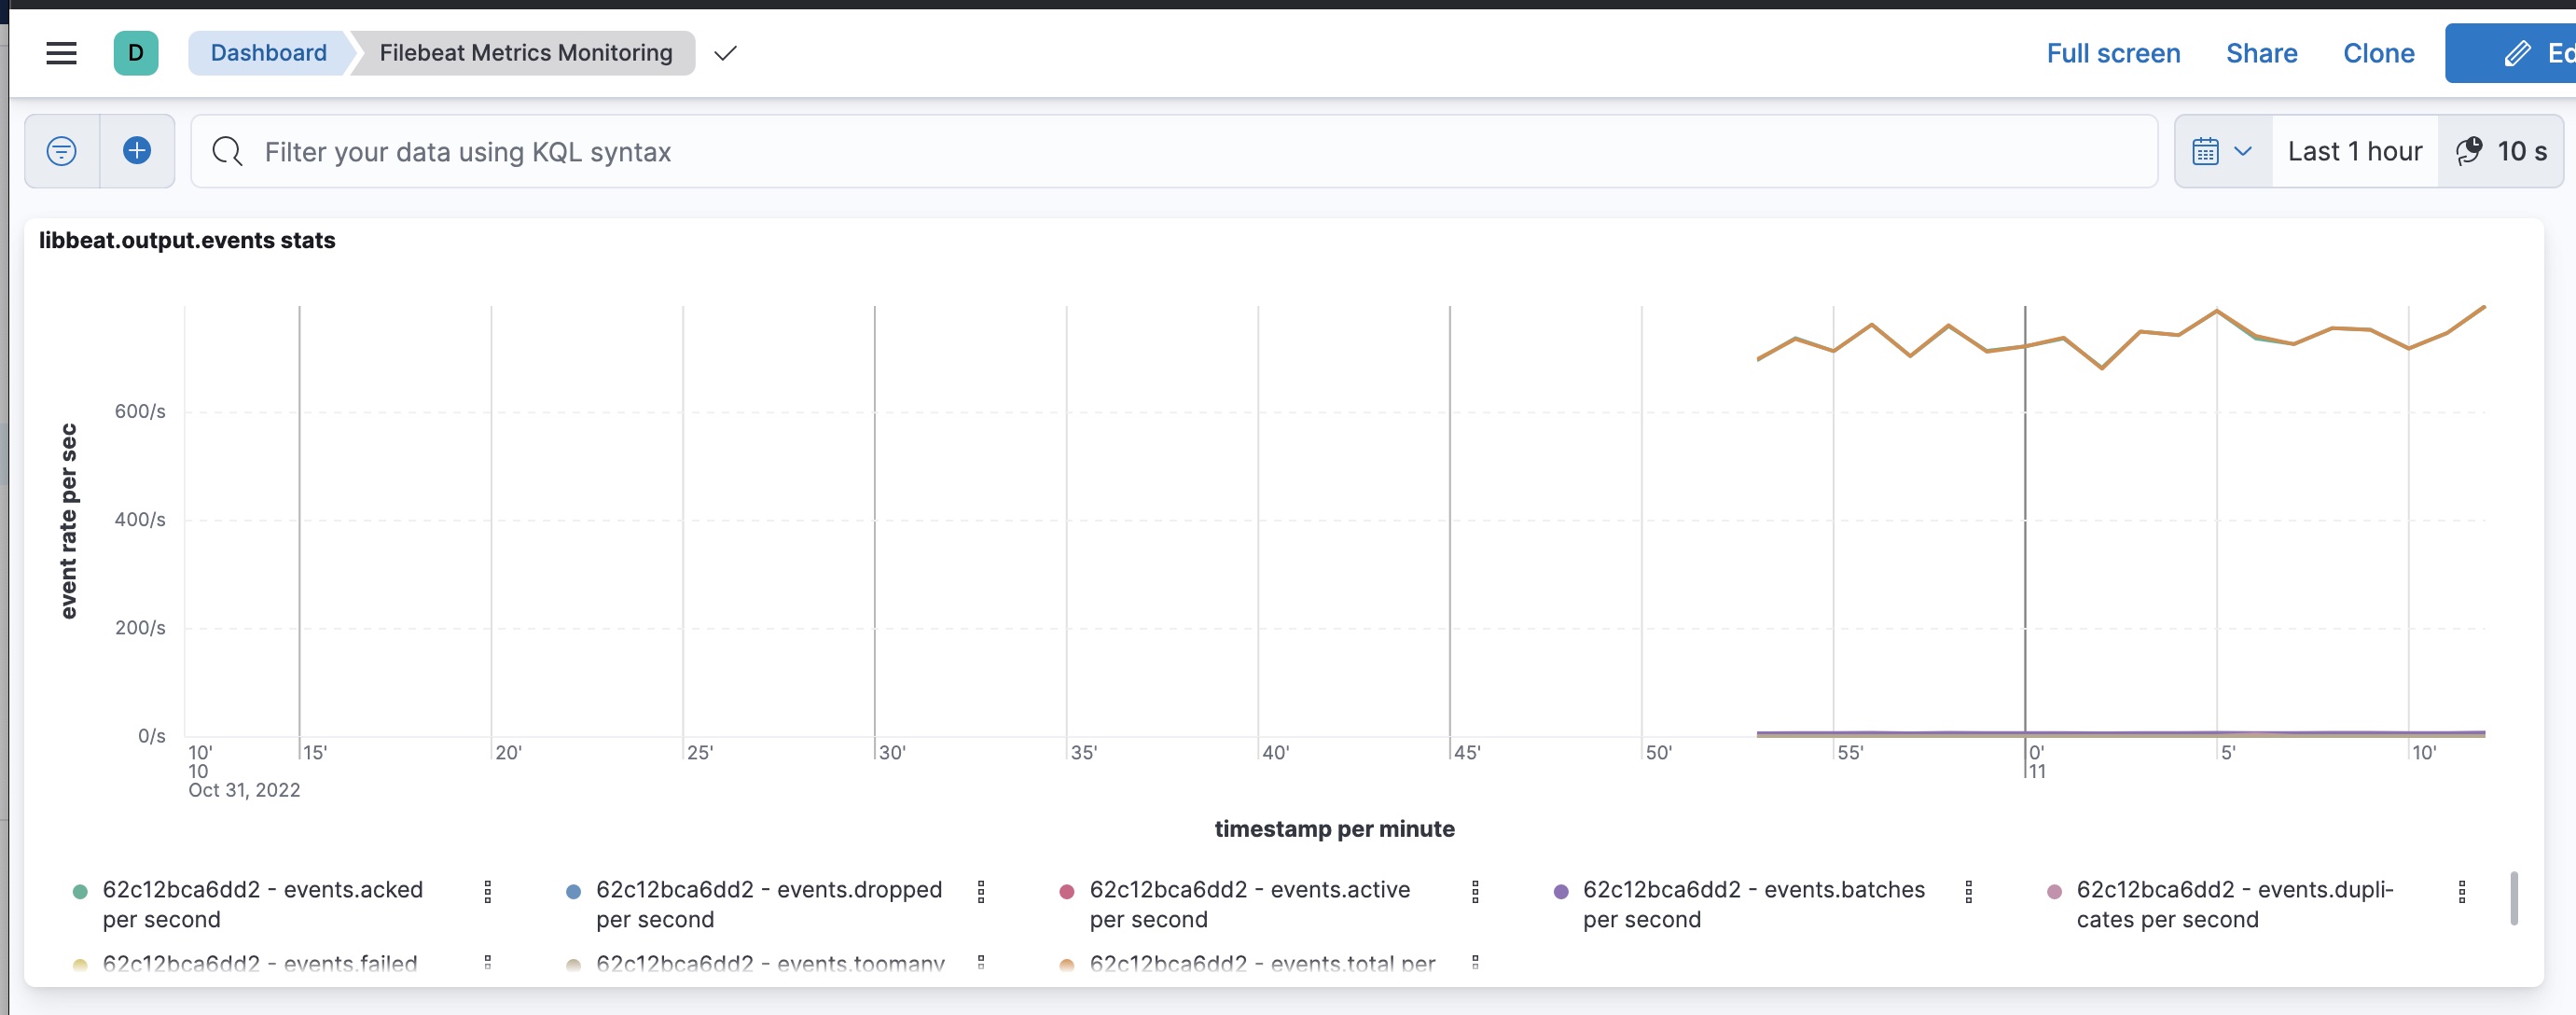
  4. Just to prove that there was indeed data flowing into ES from Filebeat - I have checked the "official" Beats Dashboard pre-packaged in ES - and it does who traffic going through the Filebeat:

So , finally, the question: what did I do wrong in creating my custom Dashboard - that it does not show any metric values, even though those metrics / events do have non-zero values?

Thank you!
Marina

Hi @ppine7

Lots of places to get tripped up here...

1st Use Lens, not the "legacy" visualizations

1A Super Important in your data view you need to use

timestamp not @timestamp

2nd Those values are monotonically increasing counters to visualize them as events per second you need to use a counter_rate and be careful between beats_state and beats_stats

3rd you need to be careful with counters because they need to be applied Per Beat (counters / counter rates) are per entity and thus per type... because a counter_rate takes the positive derivative of the max and the max could be different for each entity...

3rd See this Example

beats_stats.beat.type : "filebeat"

counter_rate(max(beats_stats.metrics.libbeat.output.events.acked))
normalized to 1s

Break down by the agent / beat host / id
beats_stats.beat.host

I only have 2 and they have equal rates ... and thus you get...

Close Up...
Field: beats_stats.metrics.libbeat.output.events.acked

Which lines up with the monitoring

thank you, @stephenb !

I think I am using Lens - I was clicking on "Create vizualization" button when creating a new Dashboard - I think it is using Lens, if I am not mistaken...

I was able to fix my dashboard following your suggestions. The issues I had to fix were:

  1. use 'counter_rate' instead of 'count' and 'Sum'
  2. pick correct timestamp for X-axis: I was using 'beats_state.timestamp' - but apparently I should have used just 'timestamp'. Still not sure why there are so many timestamps and why they differ.... but it works
  3. bucketed by host - although in my case I have only one so it did not matter much

so now I have this new vizualization:

if only I could get rid of the 'host' name as part of the legend metrics names.... and could see the actual names of metrics on the Y-axis .... right now they are very log and are created as a concat of "host_name - metric_name" and since the result is long - you can only see the first fiew characters of the name on the graph .... Any way to fix that? :slight_smile:

Thank you for your help!

Apologies... I am pretty confused ...

For Y Axis either use the default or fill in how you please.

The legend if you removed the host name how would you know which host the metric is for? I am confused seems like you need that...

Can you show me that? I don't see that..I would like to see that

You can set it to name + value ....

You can set the leggend at the bottom...

You could create a runtime field with a shortened host name...

Lots of options... but I get it everyone want's there Viz... just so...

I can see where if you put multiple Series on Same Graph it is hard to tell... not sure there is a fix for that right now

Can you show me how you got it to be host + metricname?

Right, as you can see in this screenshot:
filebeat_dash_yaxis

right now the legend for Y-axis shows cut off names of the metrics ...
The full name is very long - and you can see it if you hover over the item only .

What I'd like to see instead - is just the last part - like "event.acked" instead of the bucket+metricname, which is that long name with my full host name ...

you can see the same in the full visualization screenshot too - all metric names are cut off and you can't tell which metric is for which line in the graph until you hover over it ....

thanks!

And weird mine does not show the Axis Title mine shows the value when I turn in on

You did not show me your detailed config / setup so I am not clear how you got that.

But in the end probably not going to be able to magically fix this for you :slight_smile:

You can also tell it not to truncate, or 2 lines or put at bottom...

Or create a runtime field with just the short hostname... poke around.. the data is right... that is what is important... and besides you have the actual stack monitoring working now too right?

yes, you are right - the data is correct and it is all that matters :slight_smile:

just in case something obviously wrong jumps out - I'm showing below how I defined the Y axis and bucketing - that resulted in that weird metrics naming in the legend:

Vertical axis: multiple metrics (cut their number here for clarity):

how one of the metrics is defined:

how bucketing is defined:

and this show how the metric labels in the legend become legible - as soon as I remove the bucketing by 'host' - which removes the host name form the metric name:

Thanks!!

Odd I never get host - axis name (metric) in the legend, perhaps we are on slightly different versions

Sorry no magic.. .

Options that I see

Thank you, @stephenb !
Just to close up on this:
I was able to get a somewhat decent visualization by following your suggestions for Legends:

  • turned off truncation of the text
  • increased number of line to 2
  • placed the legend at the bottom

Also, when Filebeat is deployed on a GCP VM - the value in the beats_stats.host becomes a GCP VM instance ID - which is much shorter than the actual host name, so it looks better.
All in all - I call it a success :slight_smile:

Thank you!!

1 Like

This topic was automatically closed 28 days after the last reply. New replies are no longer allowed.