Hello
I just installed ELK + MetricBeat 6.4. I has issue with modules (resolved). So datas comming from metricbeat -
2018-09-19T09:18:24.301+0600 INFO [monitoring] log/log.go:141 Non-zero metrics in the last 30s {"monitoring": {"metrics": {"beat":{"cpu":{"system":{"ticks":828330,"time":{"ms":434}},"total":{"ticks":1706930,"time":{"ms":883},"value":1706930},"user":{"ticks":878600,"time":{"ms":449}}},"info":{"ephemeral_id":"4eabcc9a-0e85-46ab-a506-37bfdd108e34","uptime":{"ms":62670061}},"memstats":{"gc_next":7220400,"memory_alloc":4920424,"memory_total":120150206440}},"libbeat":{"config":{"module":{"running":0}},"output":{"events":{"acked":66,"batches":3,"total":66},"read":{"bytes":15276},"write":{"bytes":39146}},"pipeline":{"clients":6,"events":{"active":0,"published":66,"total":66},"queue":{"acked":66}}},"metricbeat":{"system":{"core":{"events":12,"success":12},"cpu":{"events":3,"success":3},"filesystem":{"events":7,"success":7},"fsstat":{"events":1,"success":1},"load":{"events":3,"success":3},"memory":{"events":3,"success":3},"network":{"events":9,"success":9},"process":{"events":25,"success":25},"process_summary":{"events":3,"success":3}}},"system":{"load":{"1":2.91,"15":2.43,"5":2.68,"norm":{"1":0.7275,"15":0.6075,"5":0.67}}}}}}
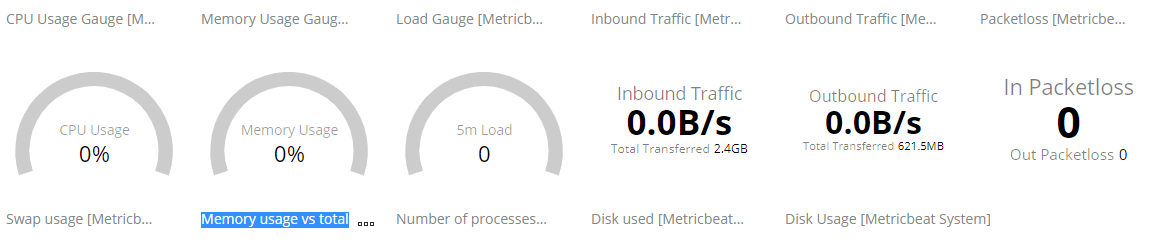
All looks good, but in kibana i see this:
how to resolve it ?
