Hello
I activated the monitoring on a Filebeat to send monitoring information to Elasticsearch. Now, in my dashboard inside Kibana I have:
It shows the behaviour when filebeat is sending data.
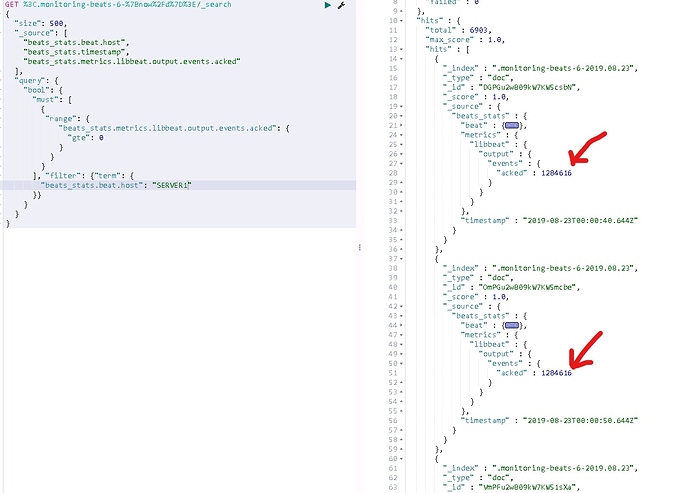
When I try to create a request inside the Console of Kibana to get the values that ilustrates the chart above, the results are cumulative. In other words, the result of the field events.acked are cumulative:
GET %3C.monitoring-beats-6-%7Bnow%2Fd%7D%3E/_search
{
  "size": 0,
  "_source": [
    "beats_stats.beat.host",
    "beats_stats.timestamp",
    "beats_stats.metrics.libbeat.output.events.acked"
  ],
  "query": {
    "bool": {
      "must": [
        {
         "range": {
            "beats_stats.metrics.libbeat.output.events.acked": {
              "gte": 0
            }
          }
        },
        {
          "range": {
            "beats_stats.timestamp": {
              "gte": "now-30m"
            }
          }
        }
      ]
    }
  },
  "aggs": {
    "hosts": {
      "terms": {
        "field": "beats_stats.beat.host"
      },
      "aggs": {
        "acked": {
          "max": {
            "field": "beats_stats.metrics.libbeat.output.events.acked"
          }
        }
      }
    }
  }
}
And the result:
{
  "took" : 1,
  "timed_out" : false,
  "_shards" : {
    "total" : 1,
    "successful" : 1,
    "skipped" : 0,
    "failed" : 0
  },
  "hits" : {
    "total" : 360,
    "max_score" : 0.0,
    "hits" : [ ]
  },
  "aggregations" : {
    "hosts" : {
      "doc_count_error_upper_bound" : 0,
      "sum_other_doc_count" : 0,
      "buckets" : [
        {
          "key" : "SERVER1",
          "doc_count" : 180,
          "acked" : {
            **"value" : 1284893.0**
          }
        },
        {
          "key" : "SERVER2",
          "doc_count" : 180,
          "acked" : {
            "value" : 8231.0
          }
        }
      ]
    }
  }
}
The SERVER1 is the server ilustrated in the chart above.
And with this query I will get the sum of all values and not the value at that moment when Filebeat is sending data:
So the questions is: "How to construct a query that reflects that chart?". I used max in the agg above just to ilustrate.
Thanks!

