Converting a quantity processed /day chart to rate /day chart

hi , need some help.
I am new to Kibana visualisation.
I have done a line chart to show the the breakdown of no of bags processed/day

I would like to do it show it as clearance rate/day. Something like below (the below is from another data source but what I want is to have the equivalent data chart for the above chart created in Kibana.
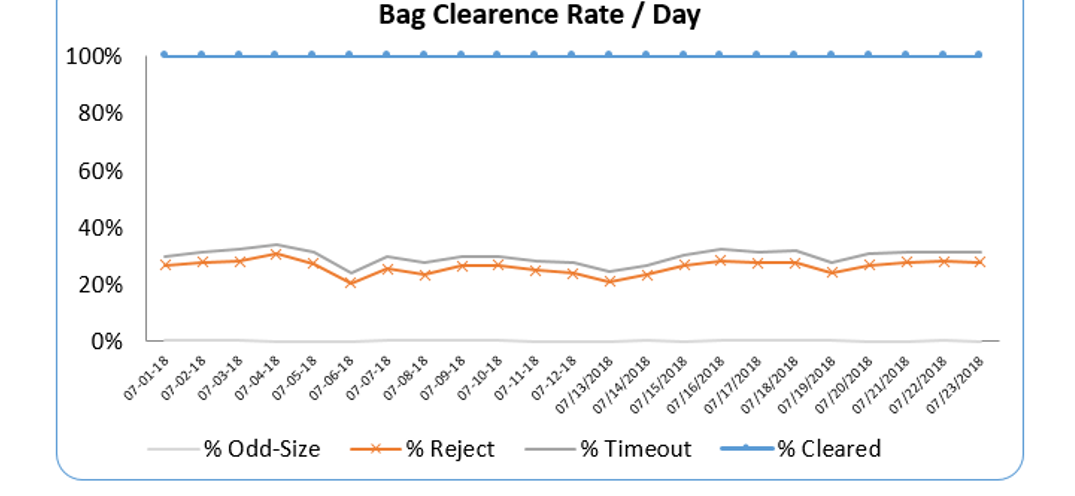
Thank you

Hi @DeniseLow,
A good fit would be to use the Time Series Visual Builder visualization:
https://www.elastic.co/blog/how-to-display-data-as-a-percentage-in-kibana-visualizations - this link is a walk-through of very similar example in the section "What is the ratio of each delay type over time?"

Marta

This topic was automatically closed 28 days after the last reply. New replies are no longer allowed.