Hi,
Is it possible to achieve these dots in table based on a condition (eg:>50 -green, <50 -Red) through vega or any other feature?
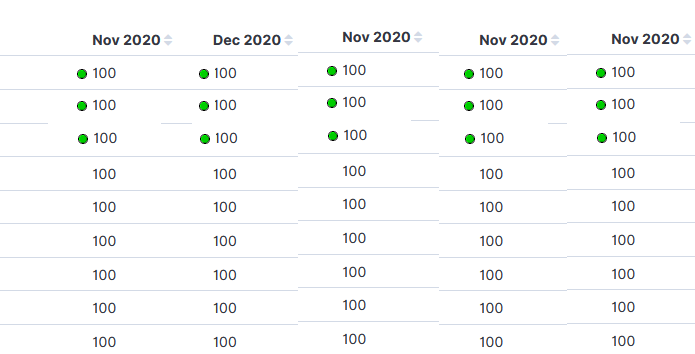
I would use a scripted field or runtime field and use the color formatter. You can color the background of a field based on values. So your 100 would have a green background in a table.
If it has to be a circle you can create this in Vega but the table portion would be the most challenging part to recreate. This would be a very difficult path to go down.
Mathu,
With something simple like this table, you can do it in Vega pretty easily by making it with an x axis (columns) with labels, and a y axis (no title, no labels). That will handle the positioning. Then for the display, it's just text on a scale. The circle you would use a unix character for (i.e. U+26AB) and then fill that character for green (U+1F7E2) or red (U+1F534) or whatever other color you want based on conditions. The hard part is the column sorting which would be really rough to do with scales. If you were willing to make each line a new mark in a group, then you could make a header mark that does the sorting via signals to the data for you. Let me know if that helps or need a better explanation there.