The Elastic Cloud service runs Elastic Cloud Enterprise (ECE) every day. And over time we've developed quite a bit of monitoring around it.
If you're running ECE in your own environment, here are a few things that you'll want to keep an eye on based on our own experiences.
1. Core system metrics
Every ECE installation has a "logging-and-metrics" cluster out of the box. Every host you install ECE onto will set up filebeat and metricbeat to report into this cluster automatically.
And we even preload beats dashboards. It's a great way to keep an eye on overall performance.
If you haven't already, log into that cluster using the process described in our ECE documentation. Once in Kibana, check out the dashboards tab for a box full of metrics, just waiting to be unwrapped!

2. Allocator capacity
Every cluster in ECE gets dedicated memory from your allocator pool. What's more, some cluster changes will create new instances to keep requests flowing while the change happens.
So it's important to keep some free memory around.
You can monitor allocator capacity using our API, like so.
curl -k -H 'Content-Type: application/json' -u root:$PASSWORD
  https://$IP:12443/api/v1/platform/infrastructure/allocators
You can also query the "admin-console-elasticsearch" cluster which maintains the latest state information for all the components of your ECE installation.
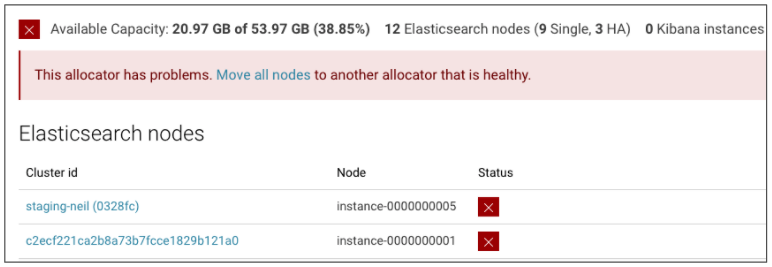
3. Allocator failures
As we all know, hardware fails. So be ready for it in your ECE installation as well.
First, plan out multiple zones that match up with your expected failure domains. This can be a hypervisor, a rack or a data center. It's up to you.
The allocator API, mentioned above, will return "status": {"healthy": false} if any allocators start showing signs of trouble. You can monitor this with a watcher alert or use an external script or service to query it periodically.
Once an allocator becomes unhealthy, you'll want to move any cluster nodes from those allocators. That process is described in the "Move Nodes" documentation.
Finally, ensure that any important clusters are running in at least two zones. Any single-zone cluster could go offline if an allocator's hardware stops working. The pre-installed "logging-and-metrics" and "admin-console-elasticsearch" clusters are good examples of important clusters, but you may have others.
4. Connection counts
In order to keep a single cluster from using up all your proxy resources, each ECE proxy will cap the number of connections at 20 per cluster. Depending on your use case, you could hit this limit. Plan to keep a connection managing load balancer in front of your ECE installation. If you don't have one available, keep an eye on connection counts so you can respond if a single client starts opening up too many connections to a given cluster.
5. Disk & Network throughput
This goes along with point #1, but it's important to focus on since Elasticsearch is often used in heavy I/O applications.
Performance testing is a great way to ensure your application isn't getting bogged down by slow disk or network. Here are a couple tools we use regularly for that purpose:
-
Fio: measures disk throughput directly and should be available with any Linux distribution.
-
Rally: measures the overall performance of Elasticsearch clusters. Rally can also index into Elasticsearch which can help build a great historical resource for performance data over time.

If you run into any signs of throughput trouble, having these or other performance tools handy can be a great way to spot the problem.