Meowin' Around the Christmas Tree: Tracking a Virtual Cat with Elastic Observability
One of the most fascinating parts of observability in this modern age is its versatility. While we usually refer to the Internet of Things for monitoring inorganic systems, we can also apply those same principles to organic, LIVING systems. What about monitoring our pets, livestock, or even our houseplants? Just as Santa would need to track which reindeer needs rest or which elf is crafting the fastest, modern systems, biological or not, require observability in order to understand their functionality. These living systems are autonomous and unpredictable, and often they do not follow deterministic scripts, making them perfect subjects for observability. In this article, we will meet MeowPy, my virtual cat, and monitor his eating, his sleeping, and maybe even his escape attempts.
The Three Essentials of Observability
There are three pillars of modern observability: logs, traces, and metrics. Logs from your application function like individual entries in Santa's naughty and nice list. They are discrete, structured events that tell us the story of what happened within our distributed system. Logs typically capture the context of your distributed system, the time the action occurred, and the details about what happened. These are usually the most robust and context-rich portion of your telemetry data.
Next in line are traces, which show the entire journey of a request through your system. They show the end to end pathway, the time spent in each service, service dependencies, and any distributed context.
Lastly, there are metrics for your application. Metrics are the quantitative data of your application such as any counters, histograms or gauges. Counters track values that only increase (like total requests served), histograms capture the distribution of values (like response times), and gauges measure values that can go up or down (like current memory usage). Metrics are highly aggregatable and efficient for alerting and dashboards.
Introducing OpenTelemetry
We can't talk about modern observability without talking about OpenTelemetry, commonly abbreviated as OTel. OTel is a CNCF open-source observability framework for standardizing the functions behind generating, collecting, and exporting your application's telemetry data. The main features of OTel include being able to connect to any observability backend, ensuring vendor-neutrality so that you can quickly switch providers or send data to multiple destinations without rewriting your instrumentation code. OTel provides consistent APIs across languages, making it easier to maintain observability standards across polyglot environments.
Using the information we have learned so far, here is a quick diagram for this demo:
Legend:
- Blue = OpenTelemetry Components
- Green = Flask/Export Layer
- Red = External Services
- Orange = Elastic Cloud
Setting Up OpenTelemetry
Getting started with OTel in your own environment is simple, and there are several ways that you can set it up. The quickest way to get started with OTel is to use auto-instrumentation. To get started with auto-instrumentation in your Elastic project with Elastic Distributions of OpenTelemetry, EDOT, simply use the command below.
pip install elastic-opentelemetry
edot-bootstrap --action=install
opentelemetry-instrument <your_service> main:app
And viola! With proper OTLP_* variable setup, your application instantly has a way to standardize any telemetry data or signals you have that you would like ingested to Elastic using OpenTelemetry.
Another way to instrument OTel in your environment is through manual instrumentation. First, you will set up a service resource for your application, in order to identify your service for the OTel SDK.
# Resource identifies your service
resource = Resource.create({
    "service.name": "virtual-cat"
})
First we will set up logging. Logs in OTel integrate smoothly with Python's standard logging module, so you can use all of the familiar Python logging patterns. We start by creating a LoggerProvider, which is tied to our service resource. An OTLP exporter pointing to Elastic uses our API key (ELASTIC_SECRET_TOKEN) for authentication. Just like we batch spans for traces, the BatchLogRecordProcesser batches our log record before export for better performance. Lastly, after setting this up as the global logger provider, we can use Python's built-in LoggingHandler that connects to OTel, which automatically captures and exports our log statements as OTel log records.
# Logs Setup
logger_provider = LoggerProvider(resource=resource)
log_exporter = OTLPLogExporter(
    endpoint=ELASTIC_ENDPOINT,
    headers={"Authorization": f"Bearer {ELASTIC_SECRET_TOKEN}"},
    insecure=False
)
logger_provider.add_log_record_processor(BatchLogRecordProcessor(log_exporter))
set_logger_provider(logger_provider)
#Bridge Python logging to OTel
handler = LoggingHandler(level=logging.INFO, logger_provider=logger_provider)
logging.getLogger().addHandler(handler)
logging.getLogger().setLevel(logging.INFO)
# Get logger instance
logger = logging.getLogger(__name__)
To capture traces, we first create a TracerProvider and associate it with our service resource. We then configure an OTLP exporter that points to our Elastic endpoint, passing our authorization token in the headers. The BatchSpanProcessor batches spans together before exporting, which improves performance by reducing the number of network calls. Finally, we set this provider as the global tracer provider and retrieve a tracer instance that we'll use throughout our application to create spans.
# Traces Setup
trace_provider = TracerProvider(resource=resource)
otlp_trace_exporter = OTLPSpanExporter(
    endpoint=ELASTIC_ENDPOINT,
    headers={"authorization": f"Bearer {ELASTIC_SECRET_TOKEN}"},
    insecure=False
)
trace_provider.add_span_processor(
    BatchSpanProcessor(otlp_trace_exporter)
)
trace.set_tracer_provider(trace_provider)

# Get tracer instance
tracer = trace.get_tracer(__name__)
For metrics, we retrieve a Meter instance, which serves as the entry point for creating metric instruments. OpenTelemetry provides several instrument types depending on your use case. A counter tracks values that only increase—perfect for counting MeowPy's escape attempts. A histogram captures the distribution of values, which we use here to record the x-coordinates of MeowPy's nap locations. When recording metrics, we can attach attributes (like the cat's name) to add dimensions for filtering and grouping in our dashboards.
# Metrics Setup
metric_reader = PeriodicExportingMetricReader(
    OTLPMetricExporter(
        endpoint=ELASTIC_ENDPOINT,
        headers={"authorization": f"Bearer {ELASTIC_SECRET_TOKEN}"},
        insecure=False
    ),
    export_interval_millis=5000
)
meter_provider = MeterProvider(resource=resource, metric_readers=[metric_reader])
metrics.set_meter_provider(meter_provider)
# Counter: Always increasing values
escape_attempts = meter.create_counter(
    "cat.escape.attempts",
    description="Number of escape attempts",
    unit="1"
)

# Histogram: Distribution of values
nap_location_x = meter.create_histogram(
    "cat.nap.location.x",
    description="X coordinate of nap locations",
    unit="meters"
)

# Recording metrics with attributes
escape_attempts.add(1, {"cat.name": self.name})
nap_location_x.record(spot.x, {"cat.name": self.name})
Meowin' Around: Introducing MeowPy
Now, since we have gone over how to instrument your python application with OpenTelemetry, I want to introduce you to our virtual cat, MeowPy!
Within our class of VirtualCat, we outline the functions that our cat can conduct and the environment that it lives in (a 100x100 virtual room).
class VirtualCat:
    def __init__(self, name: str, fence_size: Tuple[float, float] = (100.0, 100.0)):
        self.name = name
        self.fence_width, self.fence_height = fence_size
        self.position = Position(fence_size[0] / 2, fence_size[1] / 2)
There are several different actions that our cat can take, including pooping, eating, sleeping, wandering, and even trying to escape. These functions can be either manually toggled by the user or MeowPy can be placed in an autonomous mode, making decisions about what to do based on his current state (shown below). The update method uses a standard state machine with time-based transitions in order to facilitate this.
def update(self) -> None:
        """Update cat state and decide next action"""
        # Check if current action is complete
        if self.state != CatState.WANDERING:
            elapsed = time.time() - self.state_start_time
            if elapsed >= self.state_duration:
                # Action complete, return to wandering
                print(f"✅ {self.name} finished {self.state.value}, back to wandering")
                self.state = CatState.WANDERING
            else:
                # Still busy with current action
                return

        # Only make decisions when wandering
        if self.state == CatState.WANDERING:
            self.hunger += 1
            self.energy -= 1

            # Decision making
            if self.bladder > 50:
                self.poop()
            elif self.hunger > 70:
                self.eat()
            elif self.energy < 30:
                self.nap()
            else:
                self.move()
Autonomous agents like this are perfect for demonstrating observability tools because of the ubiquity of non-deterministic modern AI agents. Often times, we cannot accurately predict AI results, just as we cannot predict what our furry friends might do next!
Festive Kibana Visualizations
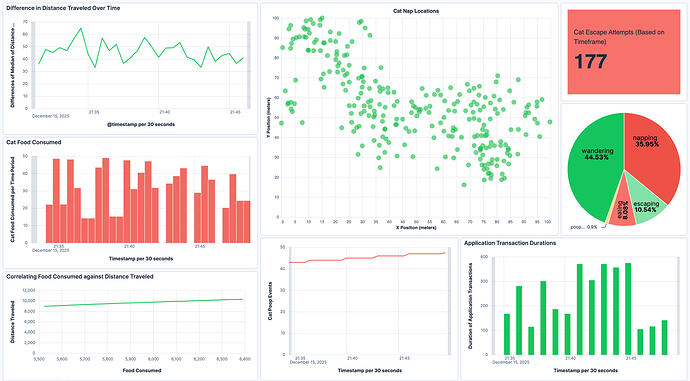
Elastic's Kibana is one of the best ways to visualize your telemetry data. Based on my virtual cat's functions, this aggregated Kibana dashboard tells me various important metrics and habits about MeowPy.
In the center, using Vega as a custom visualization, a scatterplot displays MeowPy's favorite napping spots by plotting the x and y coordinates of where he likes to sleep. In the top right-hand corner, a metric shows cat escape attempts, with conditional formatting applied to the color of the box to immediately alert any user when attempts are high. Below that is a pie chart of MeowPy's habits—as you can see, he is pretty energetic around the holidays. Below the pie chart, a bar graph shows a direct application metric rather than a cat metric: the duration of our application's transactions.
There are many ways to continue to add visualizations to your Kibana dashboards - more than can be covered now! Kibana's tools are UI no-code first, allowing anyone to visualize whatever is needed for their project.
Naughty or Nice? Observability Best Practices
To make sure that you are on the Nice List for your next observability implementation, here are some quick best practices:
- When instrumenting with OpenTelemetry, make sure to use semantic conventions with dot notation in order to create consistency across systems
-
Start with auto-instrumentation, this is the easiest and most efficient way to start using OTel
-
If you are utilizing LLM/AI systems, make sure to track token usage as a metric
-
Set up observability at the same time as your launch in order to get the most out of monitoring your application
Conclusion and Real-World Applications
While tinkering around with a virtual cat is a fun, playful approach to understanding observability, these same principles apply to real-world Internet of "Living/Non-Living" Things. There are smart pet collars that send telemetry data to their owners about the status of their pets, and agricultural sensors that monitor soil moisture and livestock health in real time.
Whether you're tracking MeowPy's escape attempts or monitoring critical infrastructure, the fundamentals remain the same: collect meaningful telemetry, visualize it effectively, and act on the insights. Happy monitoring, and may your logs always be merry and your metrics bright! ![]()


