Practitioners in the field of data visualizations distinguish between the explanatory data visualizations (using graphical tools to convey information) from exploratory. To quote Google definitions (the most authoritative source, of course), "Exploratory data visualizations (EDVs) are the type of visualizations you assemble when you do not have a clue about what information lies within your data.”
Elastic stack is a great tool for such exploration because of the flexible ways you can combine search, filtering, and aggregations to understand your data. In addition, you don't need to go through a costly process of defining a schema before you can start exploring.
Exploratory data visualization with Kibana
By their very nature, exploratory data visualizations apply in cases where someone likely has a question, but is not sure what data is available and what values it contains. They are trying to understand the data and discover its basic characteristics in preparation for using it. Tools that are well suited for this type of exploration can sample from large data sets intelligently, quickly show summaries of values available within the fields, display their distribution, and allow fast and efficient search, grouping, and filtering. By design, these are some of the core strengths of Elasticsearch. Not surprisingly, Kibana has a lot of features supporting data exploration. I will talk about some of them in this blog.
Part 1: Discovering your data in Discover
In the Discover application, users can see a list of fields available in the index and information about each field, including most common values and their distribution. On the same page they can see a histogram aggregating the number of events over time and view individual documents in either raw or table format.
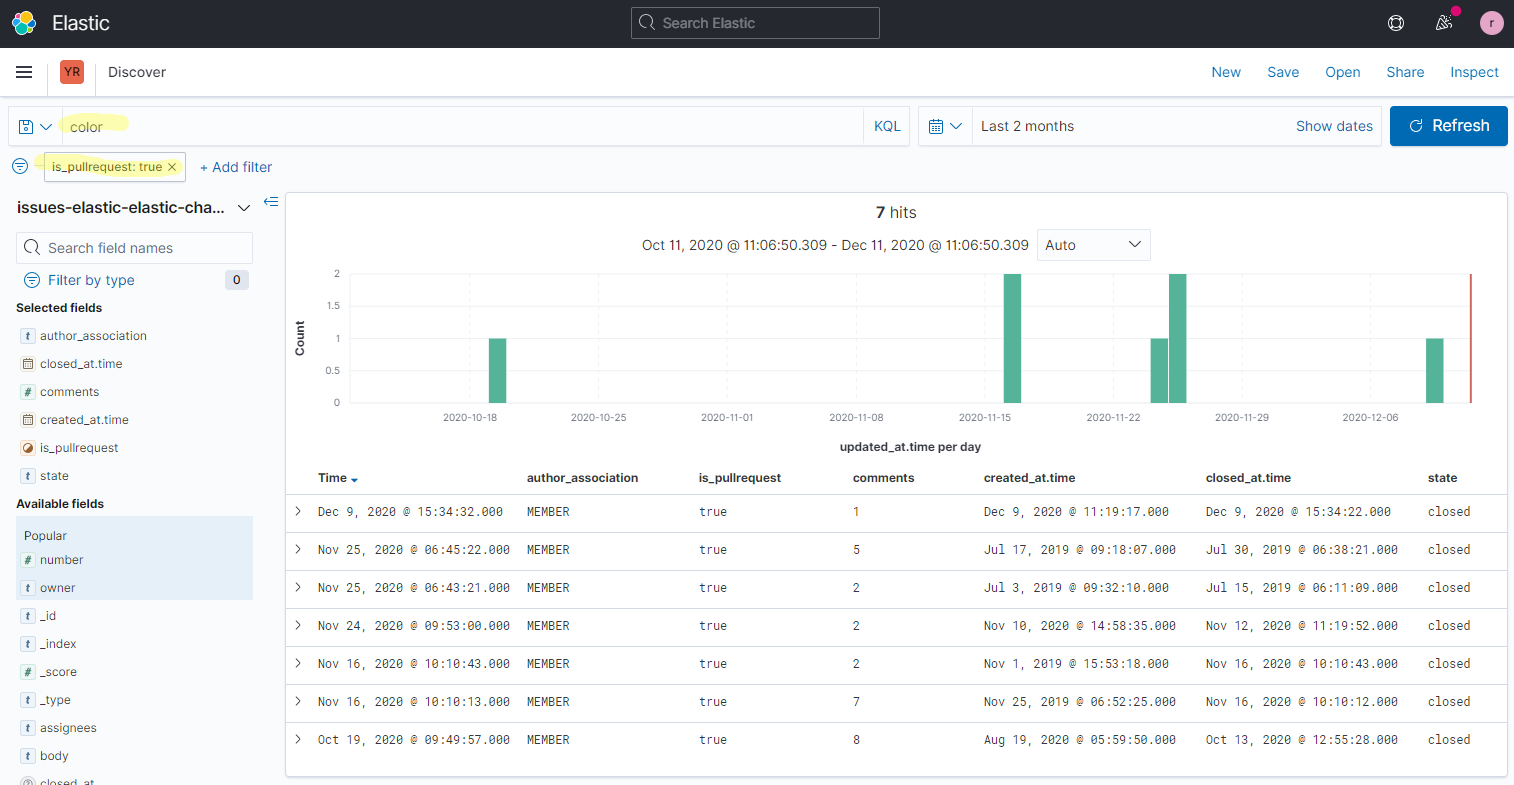
In this example, you can see github data from all elastic-charts repository over the last 2 months. Notice that the field list appears on the left and you can click on each field to view the list of most common values and their distribution. This is invaluable when exploring your dataset - not only can you get the idea of the fields and values present, you can also quickly see the distribution of the values. Finally, you can add fields that you are interested in to convert from a document to a table view of the results, allowing you to explore the data further.

All of this is nice, but one of the most powerful features of Elastic stack is ability to combine search and filtering. Notice in this instance we have also filtered down to view only the documents corresponding to pull requests. In Discover you can quickly and easily search using free text queries or structured filters with KQL syntax. Here we searched for documents containing the word “color”. Combined with the filter we set earlier, we get the list of pull requests related to chart colors.
Part 2: Exploring your data in Lens
Our new Lens data visualization tool also has features specifically targeted at this use case: similar to Discover, users can view the list of fields and understand their value distribution, search within the field list and filter by type, and preview the contents of the fields. In addition to these features, Lens allows you to experiment with various visualizations of the data to understand the outliers as well as normal value distribution. Once a field is dropped onto the visualization pane, the tool will pick a reasonable visualization to give you an overview of the data in that field quickly and then you can customize the view to explore your data.

Of course, you can also search and filter your data set in Lens, same as Discover, to focus your exploration on a subset of the data.
Part 3: Ingesting with Data Visualizer
If your goal is data exploration, getting your data into an Elastic instance is easy since the flexible nature of ES schema means you do not have to spend a lot of time thinking through the data model. As long as each document contains the relevant information in either text or named fields, you can use Kibana tools to explore it.
One of the easy ways to quickly start exploring is to use Data Visualizer in the Machine Learning application to preview contents of a csv, json, or log file before ingesting it into your instance.


Once your data is ingested, you can use Discover or Lens to explore further - and then seamlessly move to share or present your observations with supporting data in a clear and compelling manner using Dashboard or Canvas applications.