
Esse artigo também está disponível em Português
Welcome to day 20 of our Advent Calendar! Behind today’s door, we’re not finding whisky (as I usually do), but something even better for an engineer: a performance mystery with a happy ending.
I worked on a feature we were sure would decrease the overall log ingestion performance of the Elastic Agent and Filebeat, spoiler alert, to our surprise, it did not.
The feature: ingest GZIP-compressed logs
Why would one want to ingest GZIP-compressed logs? Well, logs are often rotated, new logs go to the “active” log file while old logs are kept in other files, the rotated logs. To improve storage, the rotated logs are gzipped. For us, the main use case is collecting the logs of applications running on Kubernetes, including the rotated logs which are eventually GZIP-compressed.
If you’re thinking, “but my application runs on Kubernetes and it just logs to standard out, there is no log file involved”. Well, for you there is no log file, but for us, those who collect the logs, ship them to Elasticsearch (or other permanent storage) and making them available to you on Kibana (or other frontend), they’re all log files.
In short, on Kubernetes a container logs to standard out (stdout) and standard error (stderr), kubelet reads those and saves them to a log file. The Elastic Agent and Filebeat read those files, process them and send them to Elasticsearch. If you’re curious, you can check out the Kubernetes logging architecture.
The GZIP standard allows for streaming while compressing and decompressing. That means, we don’t need to decompress the whole file, we can just read them, bit by bit, and decompress on-the-fly as we read it.
Also, some other requirements for the feature were:
- offset tracking / partial reading: can resume if the file wasn’t fully read. Only one in the market supporting it

- identifying files by fingerprint on the decompressed data: recognising a file that was first seen as plain text and later as GZIP as the same file
Elastic Agent and Filebeat: quick overview
A quick overview on the components involved, so you won’t get lost in the terms I’ll speak about
Filebeat: a lightweight shipper for logs. It’s one of the Beats, each beat ingests one type of data, Filebeat ingests files (what a surprise!)
Elastic Agent: the “all in one” managed solution. “Elastic Agent is a single, unified way to add monitoring for logs, metrics, and other types of data to a host.”
The Elastic Agent configures and runs the Beats behind the scene to collect the desired data. It can be centrally managed by Fleet or deployed standalone.
Filebeat can collect data from different sources, for each source, the component that collects the data is called input. filestream is the input used to ingest log files. After the data is read, it’s processed in the Pipeline and sent out to the output which ships the data to a permanent storage (eg. Elasticsearch) or further processing (eg. Logstash).
Development process
As we expected this feature to reduce the overall log ingestion performance, we started with a proof-of-concept, POC, isolating the part of filestream which actually reads the files and benchmarking it against reading plain files. As expected, it was slower, but not to the point it’d be prohibitive.

Then we decided to proceed with the implementation and once it was all done, we’d benchmark it to understand the performance impact and explain to our users what they should expect when ingesting GZIP files.
Benchmarks
We have two different types of benchmark, end-to-end and the standard Go/micro-benchmarks
End-to-end
We have an internal tool called “benchbuilder” to perform end-to-end test of the beats (filebeat, metricbeat, and so on) and the Elastic Agent. It focuses on user experience, using logs per second (referred to here as events per second or EPS) as its key metric. More complex and requires extensive setup.
Go / micro-benchmarks
Regular Go benchmarks, testing a function or small component to assess if a new implementation is indeed better or we aren’t degrading performance with new features or refactors. Easy and cheap to develop and run.
What we measured
-
EPS (events per second): how fast can we output logs
-
CPU usage: how much CPU is used
-
Memory usage: how much memory is required
Use cases
-
many small files 1000s of 10MB files. This simulates Kubernetes log rotation in a high-load environment
-
1 huge file, several GBs. Ensure it can work with files larger than the available memory
The first, still work-in-progress benchmark


To our surprise, the 10mb gzipped file was, by a small margin, quicker!
Let's have a look at all benchmarks then make sense of the results.
EPS comparison
1 file of 45GB and 4150 files of 10MB each
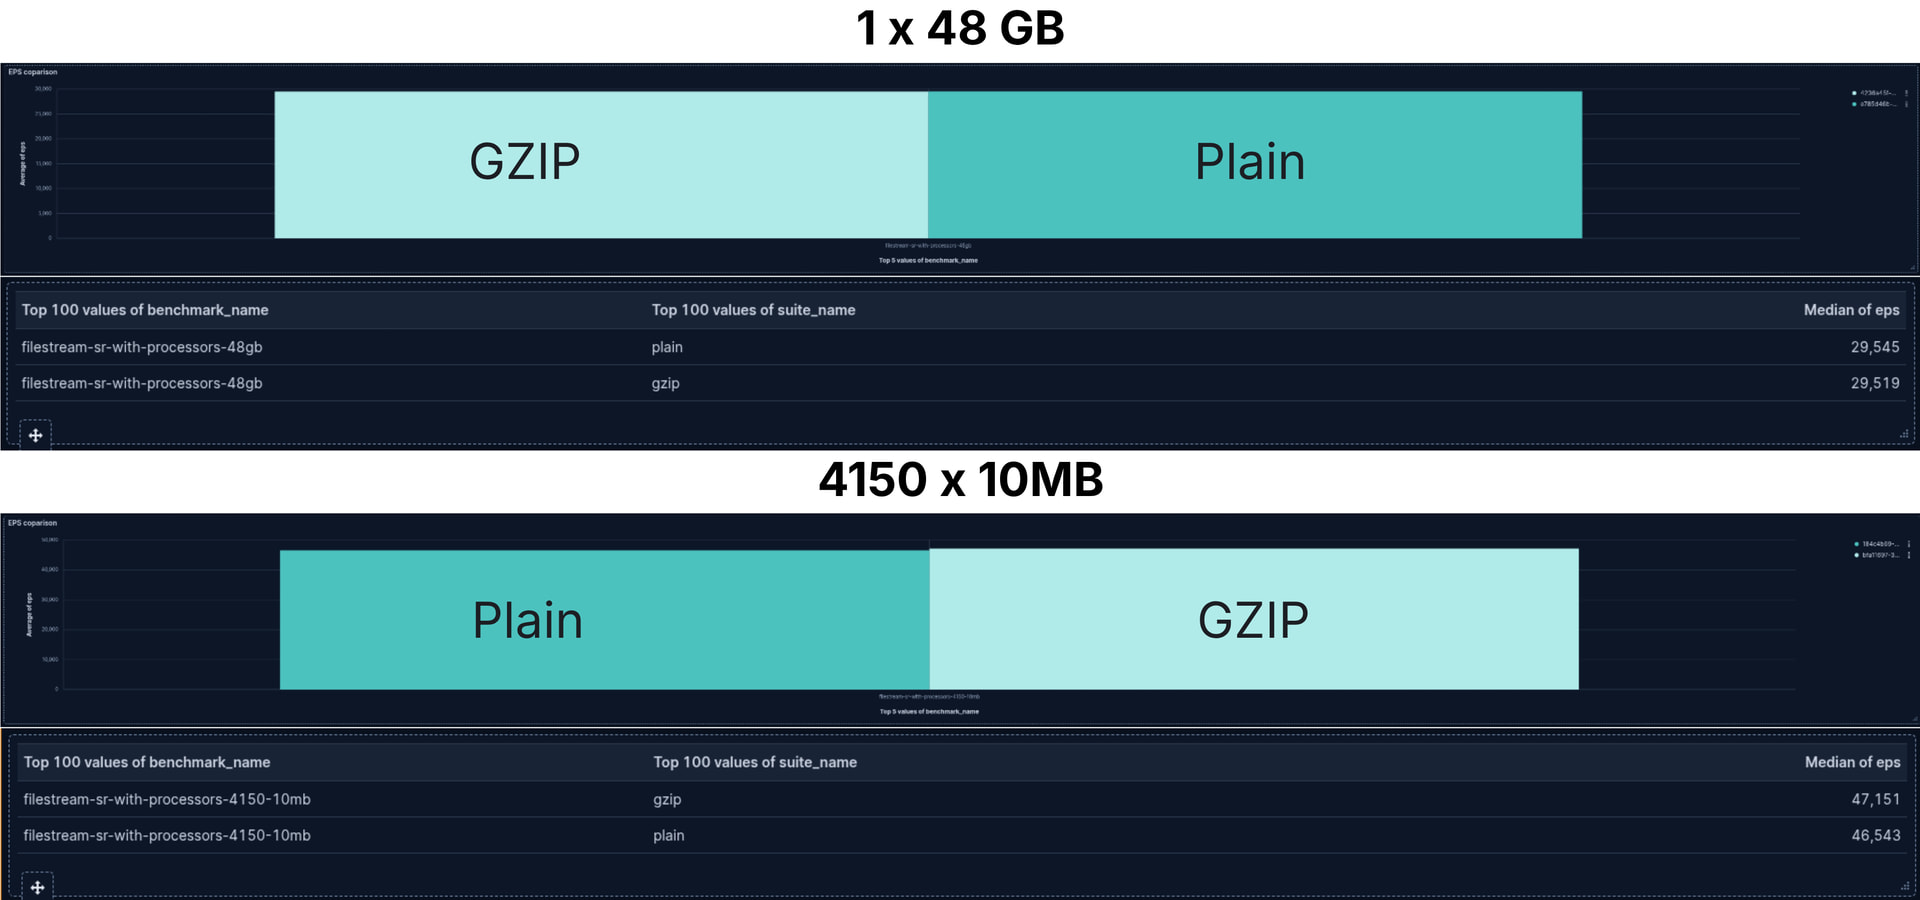
What a surprise! The difference between the throughput performance, the events sent to Elasticsearch per second, we see a negligible difference. Not only that, but for the case with 4150 small files, reading GZIP files was a wee bit quicker.
CPU usage


Again, for the CPU usage we don't really see any difference. What we observe is reading thousands of small files consumes more CPU than reading a single large file. As is expected. There is a lot going on between detecting a new file exists, opening it for reading and then closing it once it's fully ready.
Memory usage

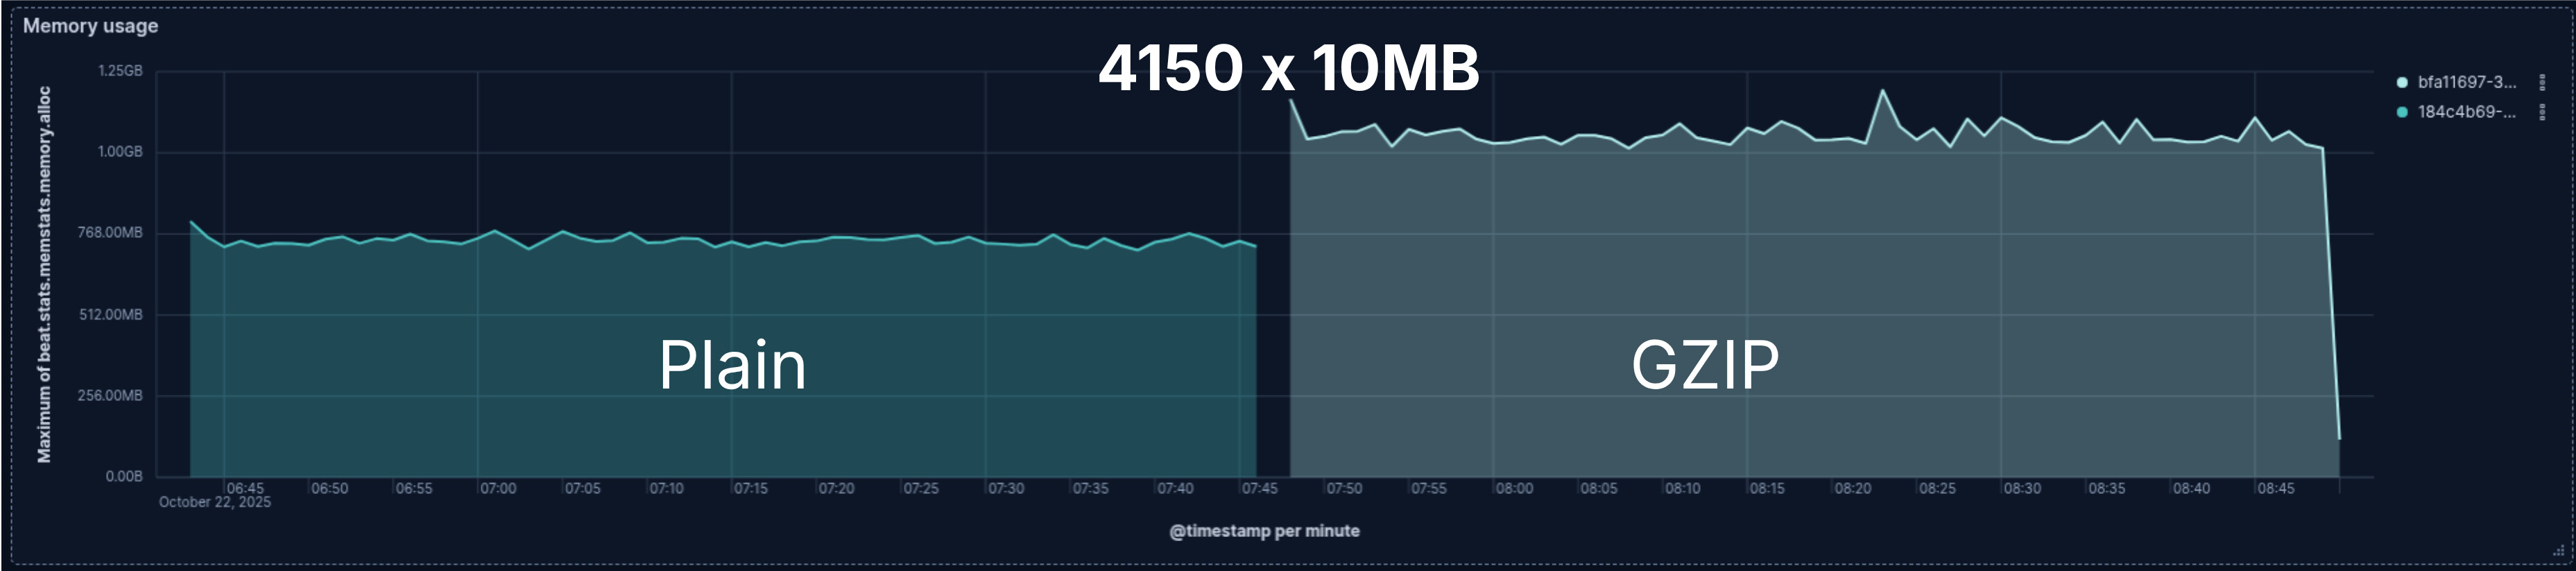
Finally, at least once, common sense for the win! Well, only a 0.5 win.
Reading the 4150 GZIP files needed more memory than their plain counterparts. However, even though while reading the 48GB file the memory consumption isn't really stable, both the plain file and the GZIP use about the same memory.
With the end-to-end, more Go/micro-benchmarks and knowing how the GZIP decompression library works we determined there is about 100KB of memory increase per GZIP file being read. That's why we don't see GZIP decompression causing an impact when reading one 48GB file. The extra 100KB is irrelevant in the overall memory consumption.
On the other hand, it becomes significant when thousands of files are read at the same time. One might need to account for that. The number of files being read in parallel and when they're closed can be configured to help to mitigate the impact of the memory increase.
Making sense of the results
Ok, we know data don't lie, well at least if the experiment and data collection were properly done, which was true in this case. So, why does the data seems to go against the common sense and my first benchmarks?
Understanding how Filebeat works
As I mentioned in the beginning, Filebeat is the one doing the heavy lifting and indeed reading the files, the Elastic Agent just runs Filebeat under the hood.
Filebeat, and any other Beat, internally has three main components: Input, Queue/Pipeline, Output.

Input: filestream
The input is the component actually reading the data, then it publishes the data to the Pipeline. In our Go benchmarks, as the very first I showed to you, we see filestream is slower when reading GZIP files. Further Go/micro-benchmark confirmed it. The data is read at a slower pace then sent to the Pipeline queue.
Pipeline / Queue
It's on the Pipeline the collected data if further processed and transformed. The processors are part of the Pipeline. They transform the data, among other things, adding, modifying and removing fields on the logs. As they transform the data, modify its form, the processors are applied in sequence. The output of a processor is the input to the next:
event -> processor 1 -> event1 -> processor 2 -> event2 ...
Some transformations are destructive, that means they cannot be reverted, specially if they fail. Thus, to guarantee data integrity if any processor fails, we abort the pipeline and publish the output of the last successful processor. This guarantees we deliver consistent data even if a failure occurs. For the processors performing destructive actions, they're applied to a copy of the log. This copy operation usually involves memory allocation, it has a cost in performance to it.
Given that, removing the processors might do the trick, without them we might see reading GZIP files slower, right?
Yes, and no! Indeed, the processors have a non-negligible overhead, we can see with the processors the EPS is around 20,000 per second, without them, 25,000. It's considerably faster. Nevertheless, a negligible difference between GZIP and plain files.
Not only the processors are applied in sequence, but the logs are also processed in sequence. There is a queue in between the input, the pipeline and the output. As any queue, of people or logs, if the queue "does not walk fast enough" and people (or logs) keep arriving faster than things leave the queue, the queue will only grow. Input is a fast runner stuck behind a slow-moving queue.
On Filebeat, once the queue is full, the input stops reading data and waits until there are free spots in the queue.
That's what is happening! filestream is quicker than the Pipeline, much quicker, so much so, even when it's slower, due to the GZIP decompression, it's still quicker than the Pipeline. The input (filestream) blocks, it stops reading data and waits spots to open up in the queue to continue reading data.
Also, it aligns with what we observe when helping users to optimise and increase their Filebeat throughput. A good amount of work is put into find the ideal queue configuration for the users use-case.
Conclusion
When dealing with performance, never, ever guess—always measure!
Measure everything: the micro, localised changes as well as the application end-to-end, ideally as a black box. A gain or loss in performance on a part of the application might not impact the overall performance as expected.
We now know for a fact we have some room on filestream to add features which might reduce its throughput and still not affect the overall application performance. At the same time, if we want to improve the overall performance, we should focus our efforts on the Pipeline, the Processors, and the Queue.
Happy ingesting!