This article is also available in French.

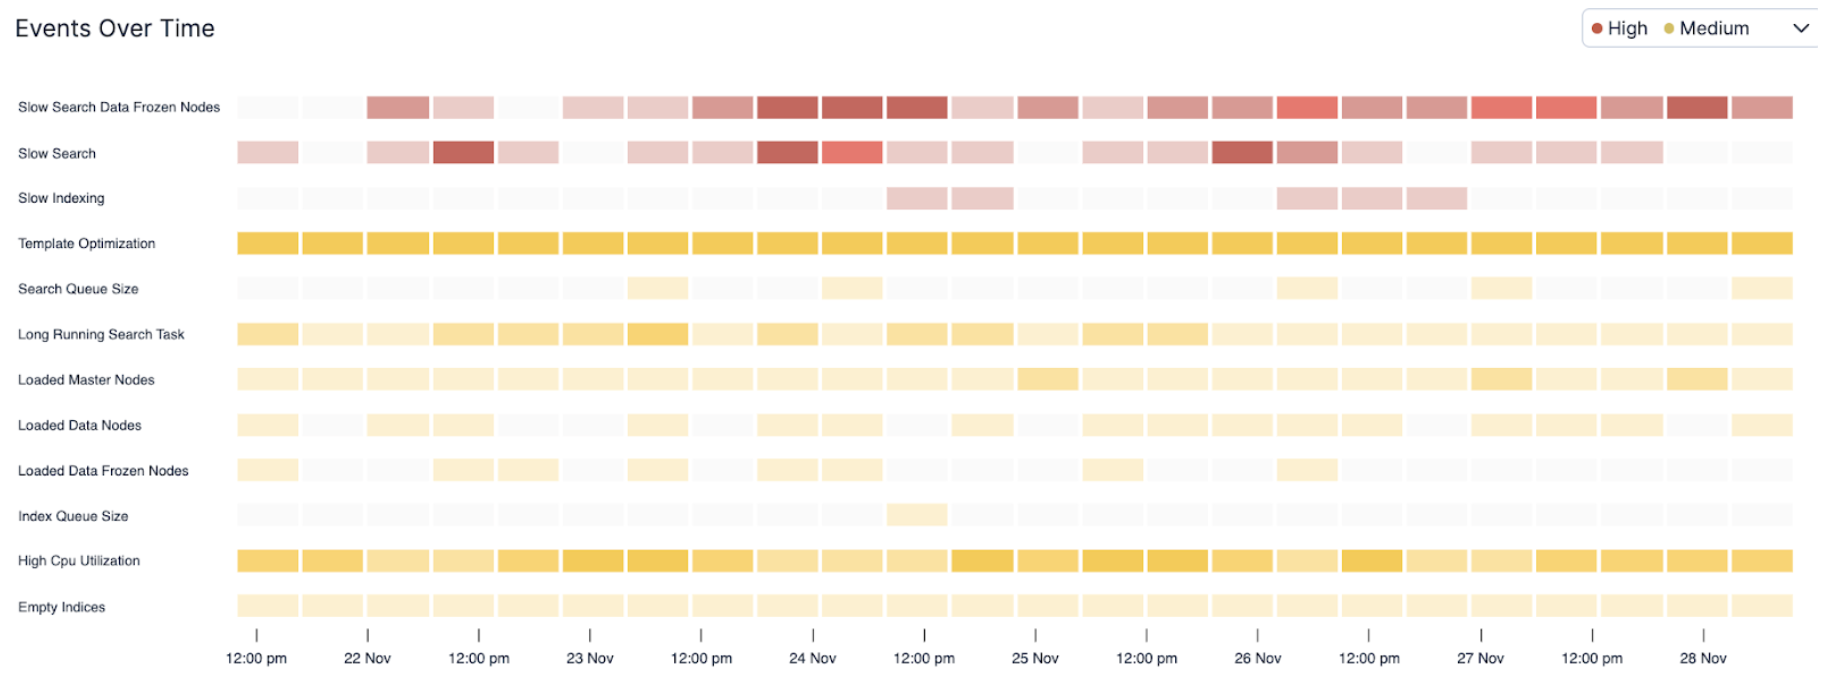
AutoOps helps you diagnose issues in your Elasticsearch cluster by collecting, analyzing and correlating hundreds of metrics in real-time, providing root-cause analysis and accurate resolution paths. Every time an issue is detected, AutoOps keeps track of it and shows it to you on a timeline like the one shown below. You can easily see which ones pop up regularly, the colors give you a sense of their severity and the darker the color the more events of that type happened during a specific time range.
When you have an urgent issue to solve and you’re running against time, you could use a little help to pinpoint where to start your investigation and what to focus on. Leveraging Elastic AI, we were able to correlate the discrete cascading events we see above into a coherent story leading up to the identification of the root causes and what should be done to remediate them.
We opted for a “chat-first” approach by plugging our newly released Elastic Agent Builder on top of all the insights data available on the timeline above. Without further ado, we started chatting with it, and here is how it went.
Warming up
Our first intent was to solve the current issues that were harming the cluster, so we started the conversation as follows:

After quickly looking at the index mapping to figure out how to query our insights data, the Elastic Agent Builder created a few subsequent queries to retrieve recent high severity issues that were currently opened, categorized them by type and frequency, dove into their context to understand which nodes or indices were involved, retrieved other insights related to the identified nodes and indices, and finally read the insights descriptions to formulate its initial answer shown below:
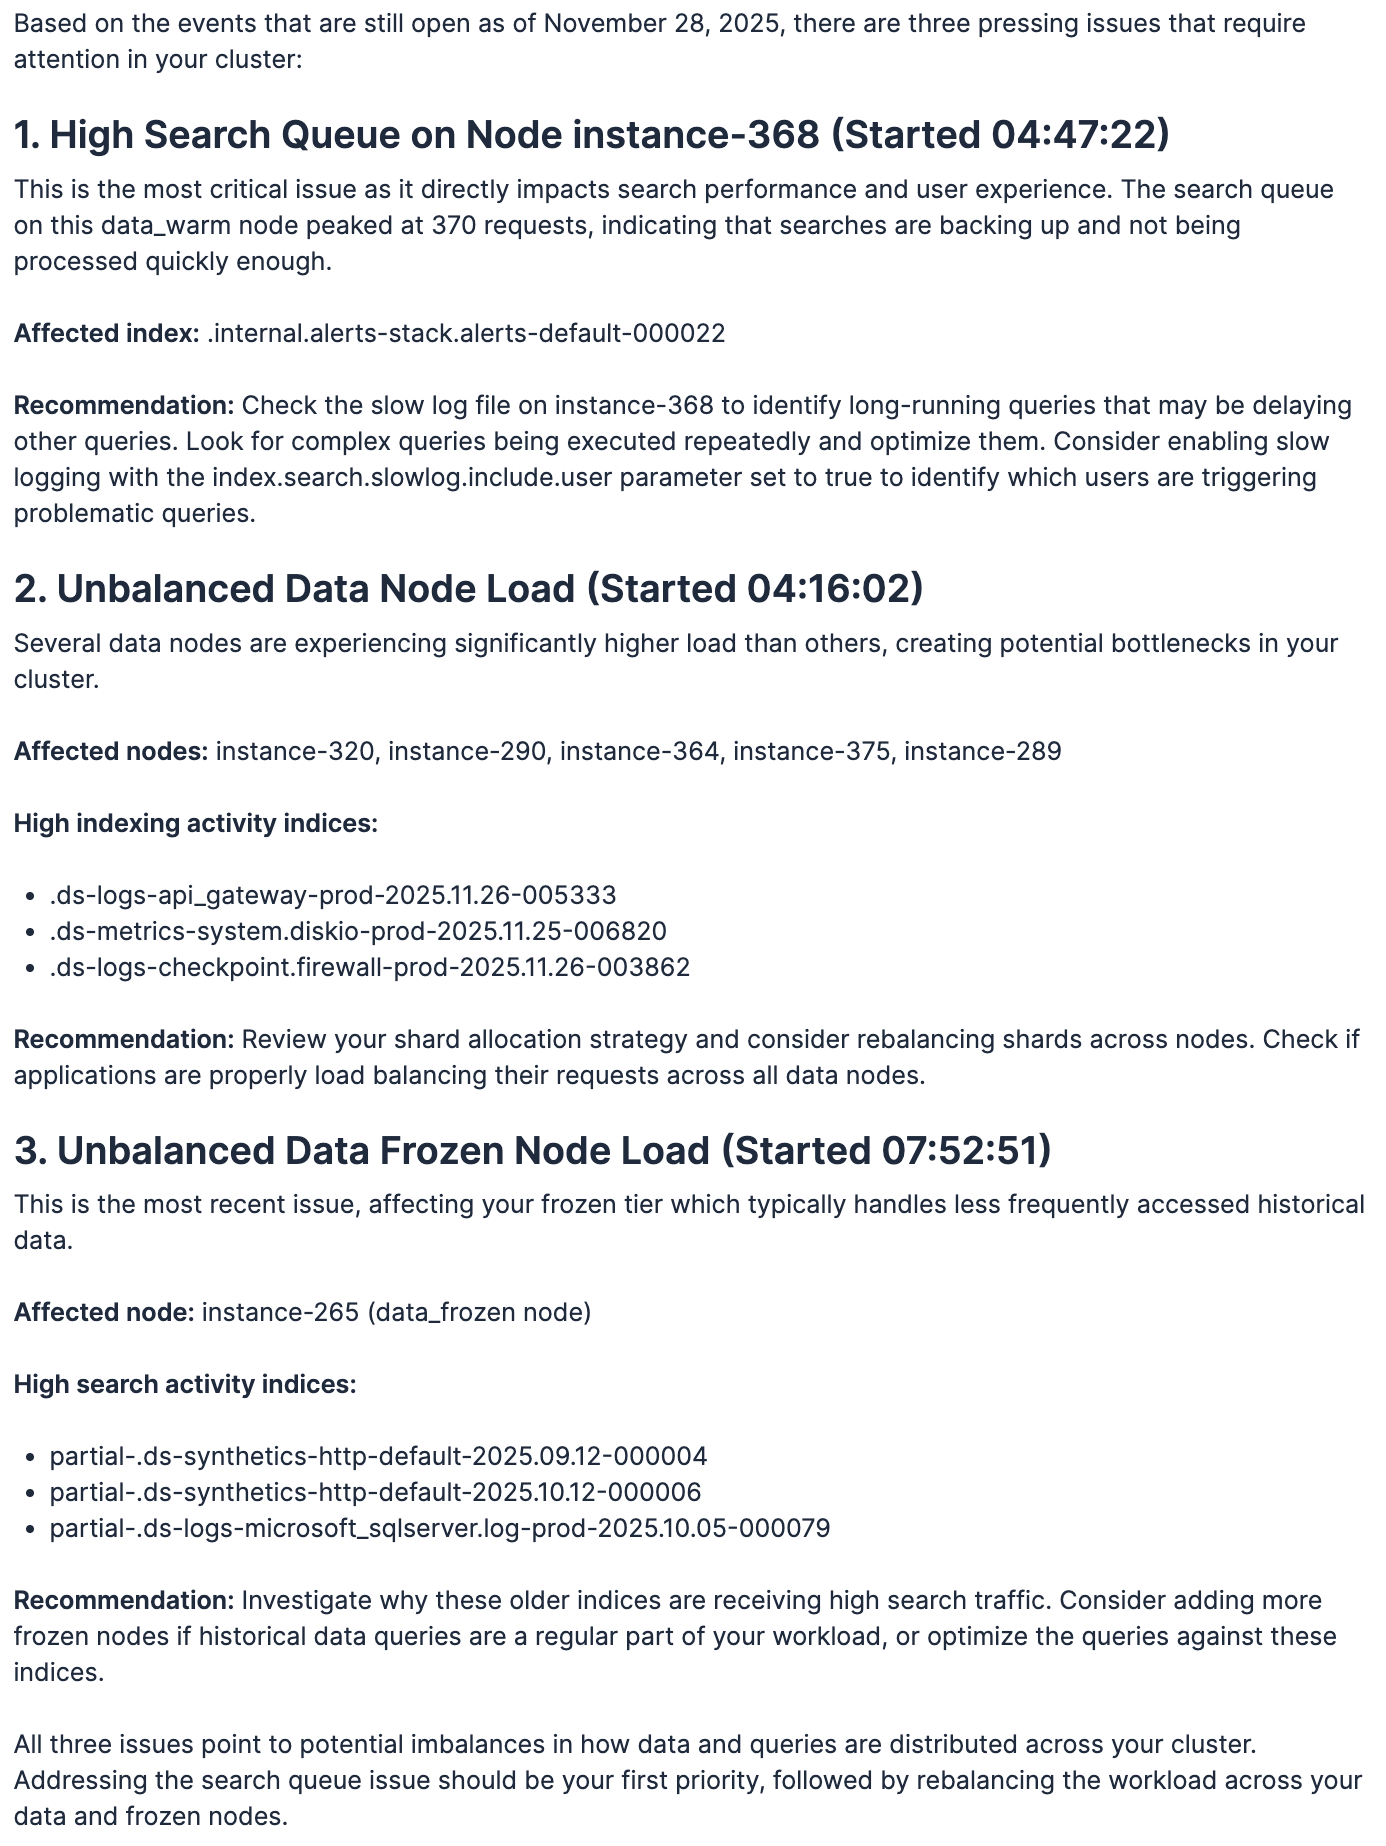
Wow!! And that took only 79 seconds to work through more than ten thousand events and correlate them into a story that we could actually understand. Now let’s dive in a little bit deeper.
Issue #1: High Search Queue on Node instance-368
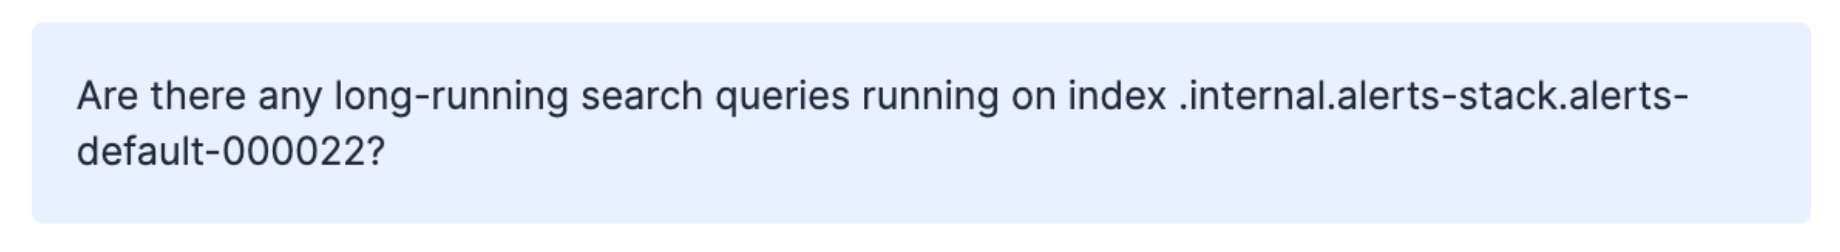
Looking at the first issue and the affected index, we didn’t even need to look at slow logs because we knew it had to do with Kibana alerting rules. We could easily tell Kibana was also struggling to execute them, but there were too many rules to know which ones were problematic. So, since the recommendation was to look at long-running queries and AutoOps captures them, let’s just find out which one is causing this:
In a matter of seconds, the following DSL query popped up, and we were able to easily spot the ID of the alerting rule in the X-Opaque-ID HTTP header that AutoOps also captures (highlighted in red below).
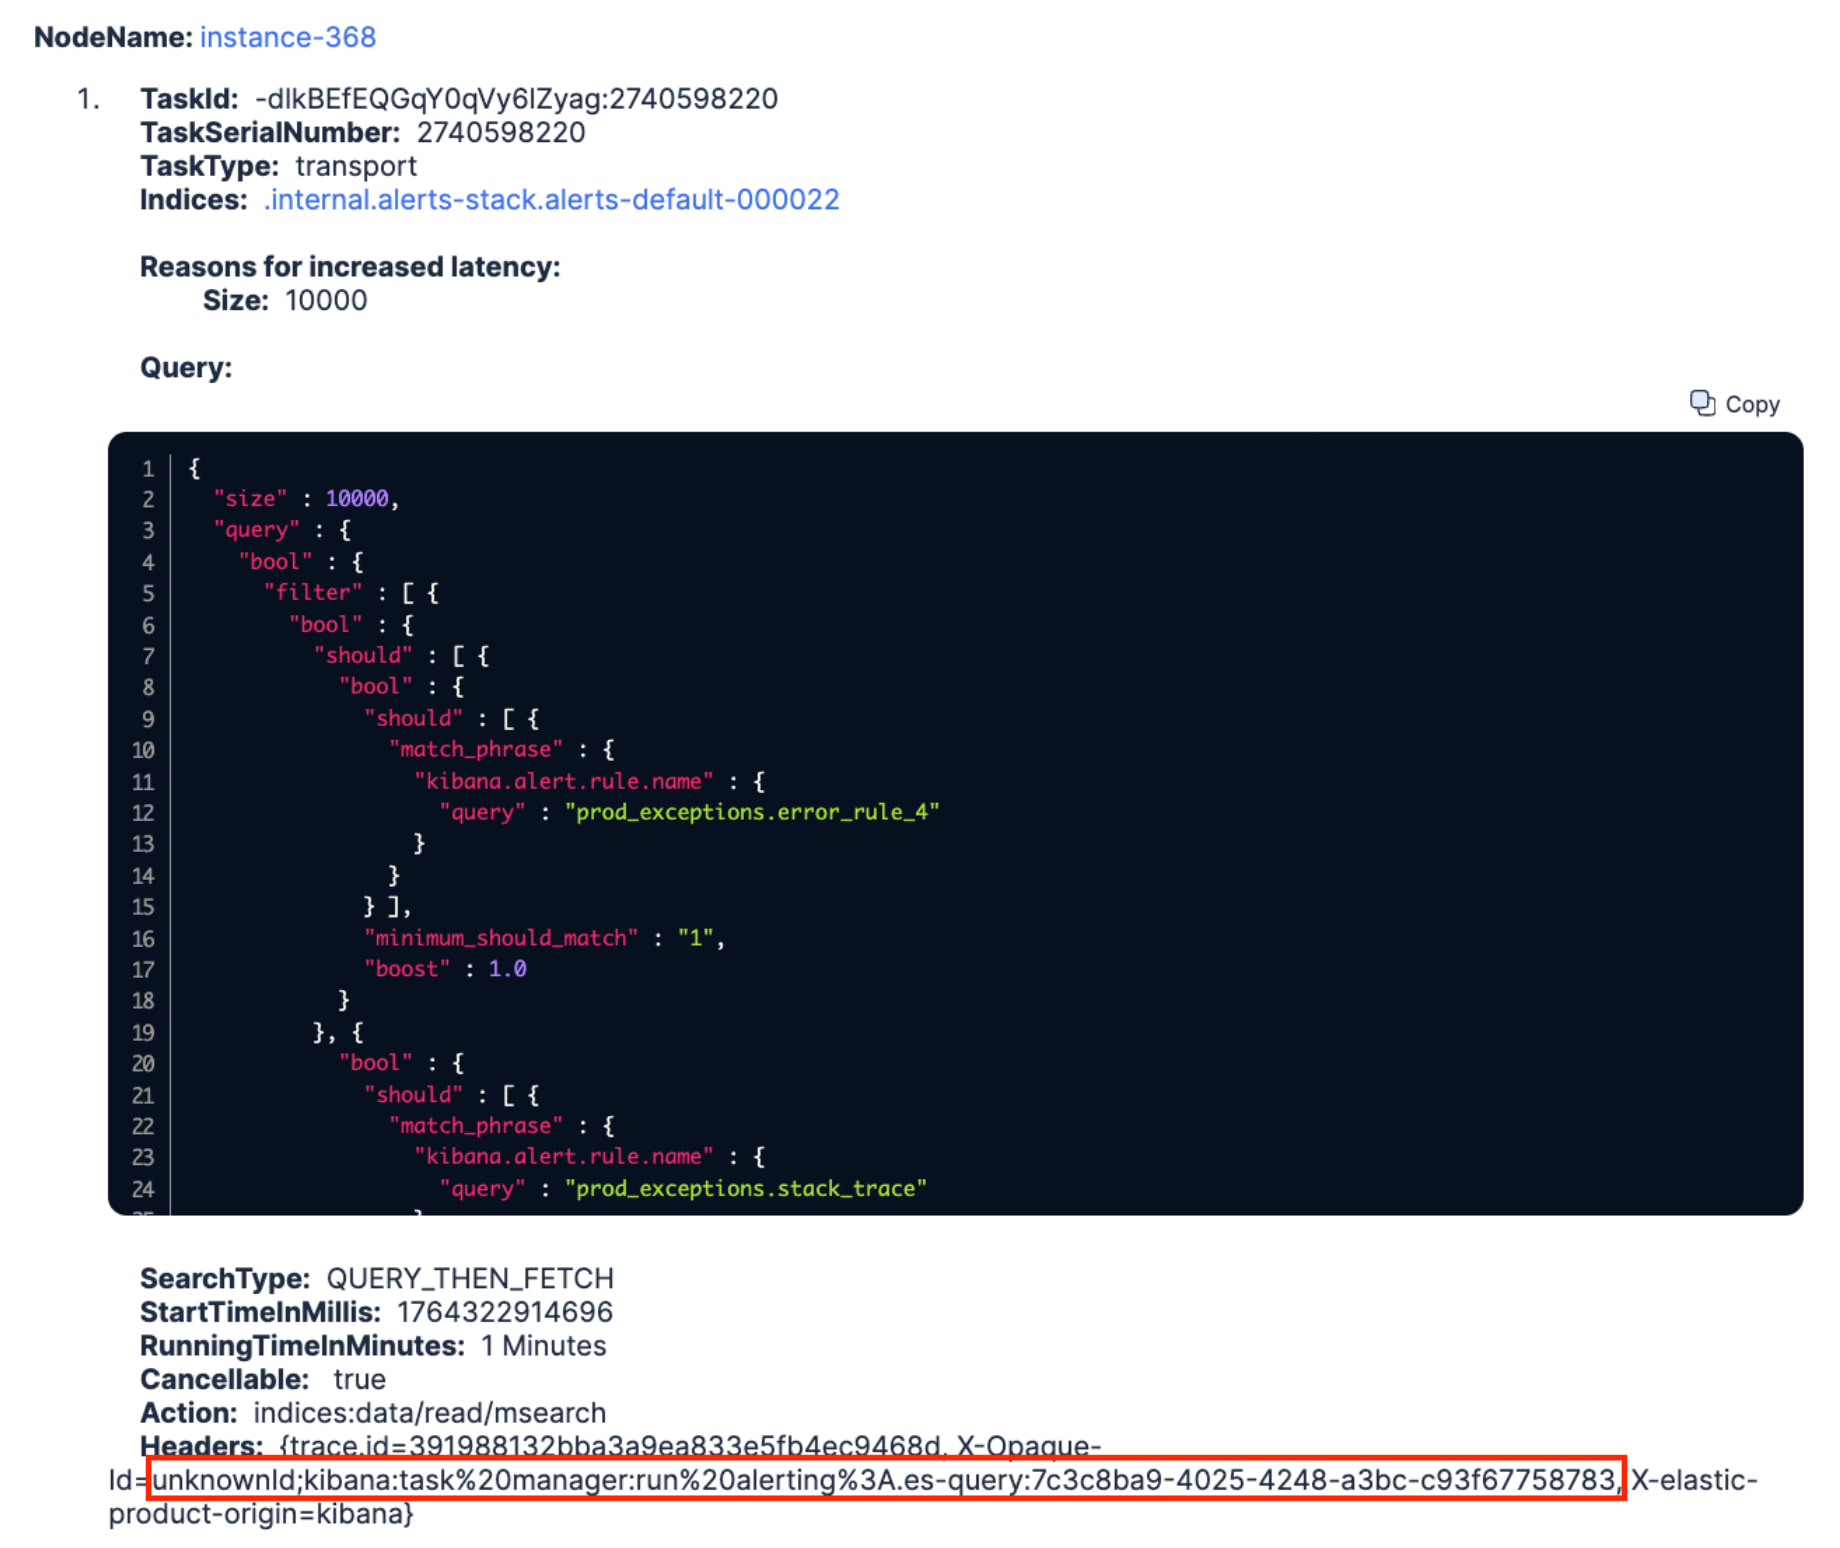
We went back to Kibana and improved the query a little bit (i.e., we didn’t need to retrieve 10000 hits). We also revised its scheduled frequency which was unnecessarily high, and we finally saved the rule. A few minutes later, we could see the search queue of instance-368 decrease down to 0. Done ![]()
Issue #2: Unbalanced Data Node Load
Ok, what’s next? The second issue was self-explanatory. Since the recommendation was to look at our shard allocation strategy, a quick glance into the AutoOps shard view enabled us to easily pin down the three indices with high indexing activity and discover some indexing hot spots on the identified nodes.
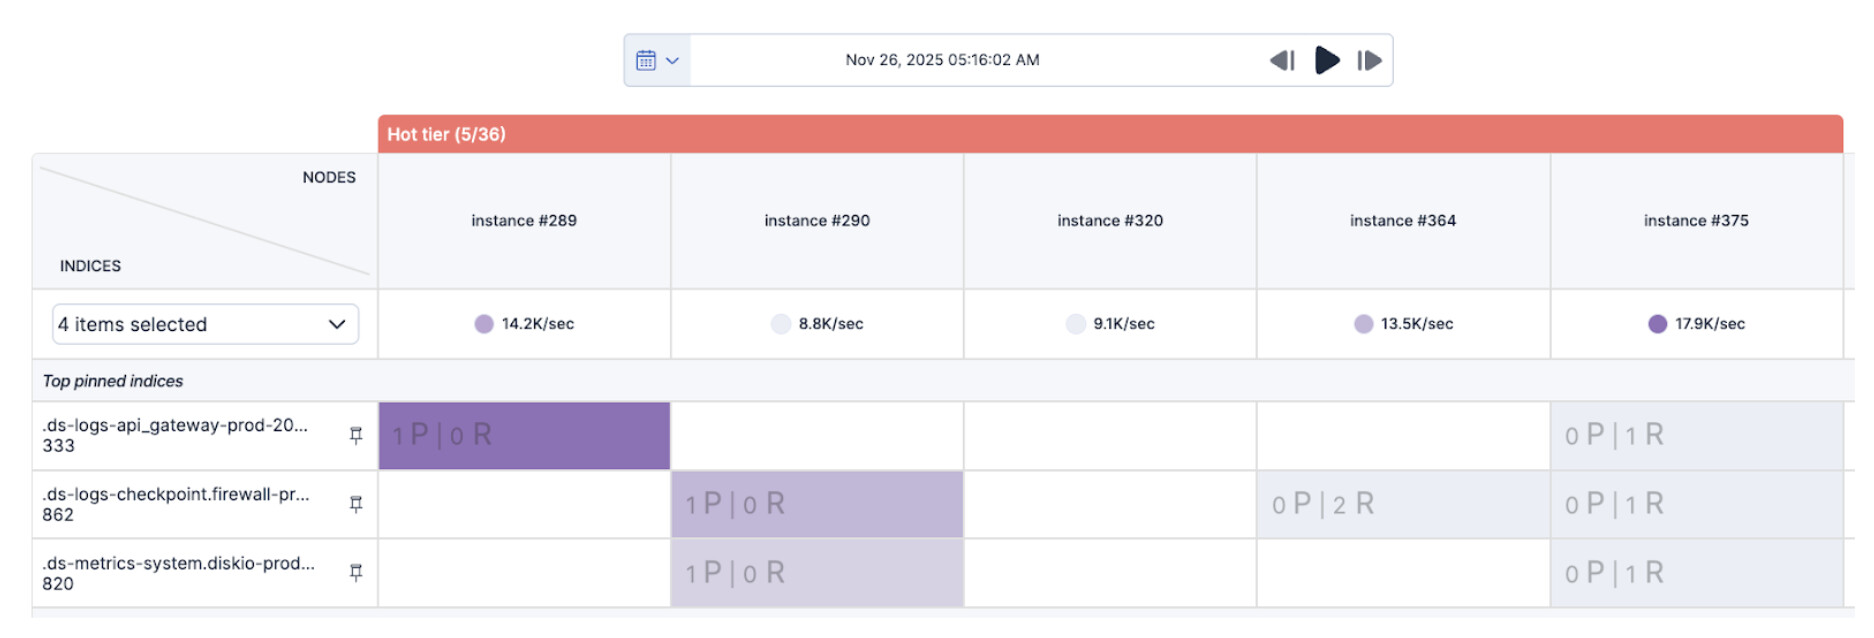
As those indices only had three primary shards that were all allocated to the same set of nodes and their size was growing faster than we expected, we decided to double their number as there were enough hot nodes to handle the additional shards. We then rolled over the respective data streams and hot spots disappeared. Done ![]()
Issue #3: Unbalanced Data Frozen Node Load
To troubleshoot this last issue, we again leveraged the Elastic Agent Builder to help us out. We basically dog-fooded it with its own recommendation and asked it to find any queries running on the identified indices. There’s obviously some room for improvements as it should have automatically applied its own recommendation to figure out where that search traffic was coming from. But anyway, let’s ask and see what happened next:

A few seconds later, it returned a nice long-running query that had been running for 158 minutes (>2h30) on all partial-.ds-synthetics-http-default* indices. Similarly to the first issue above, looking at the query we could see that it was running over three months of data (two of which already reached our frozen tier) and it was trying to aggregate a huge amount of buckets.
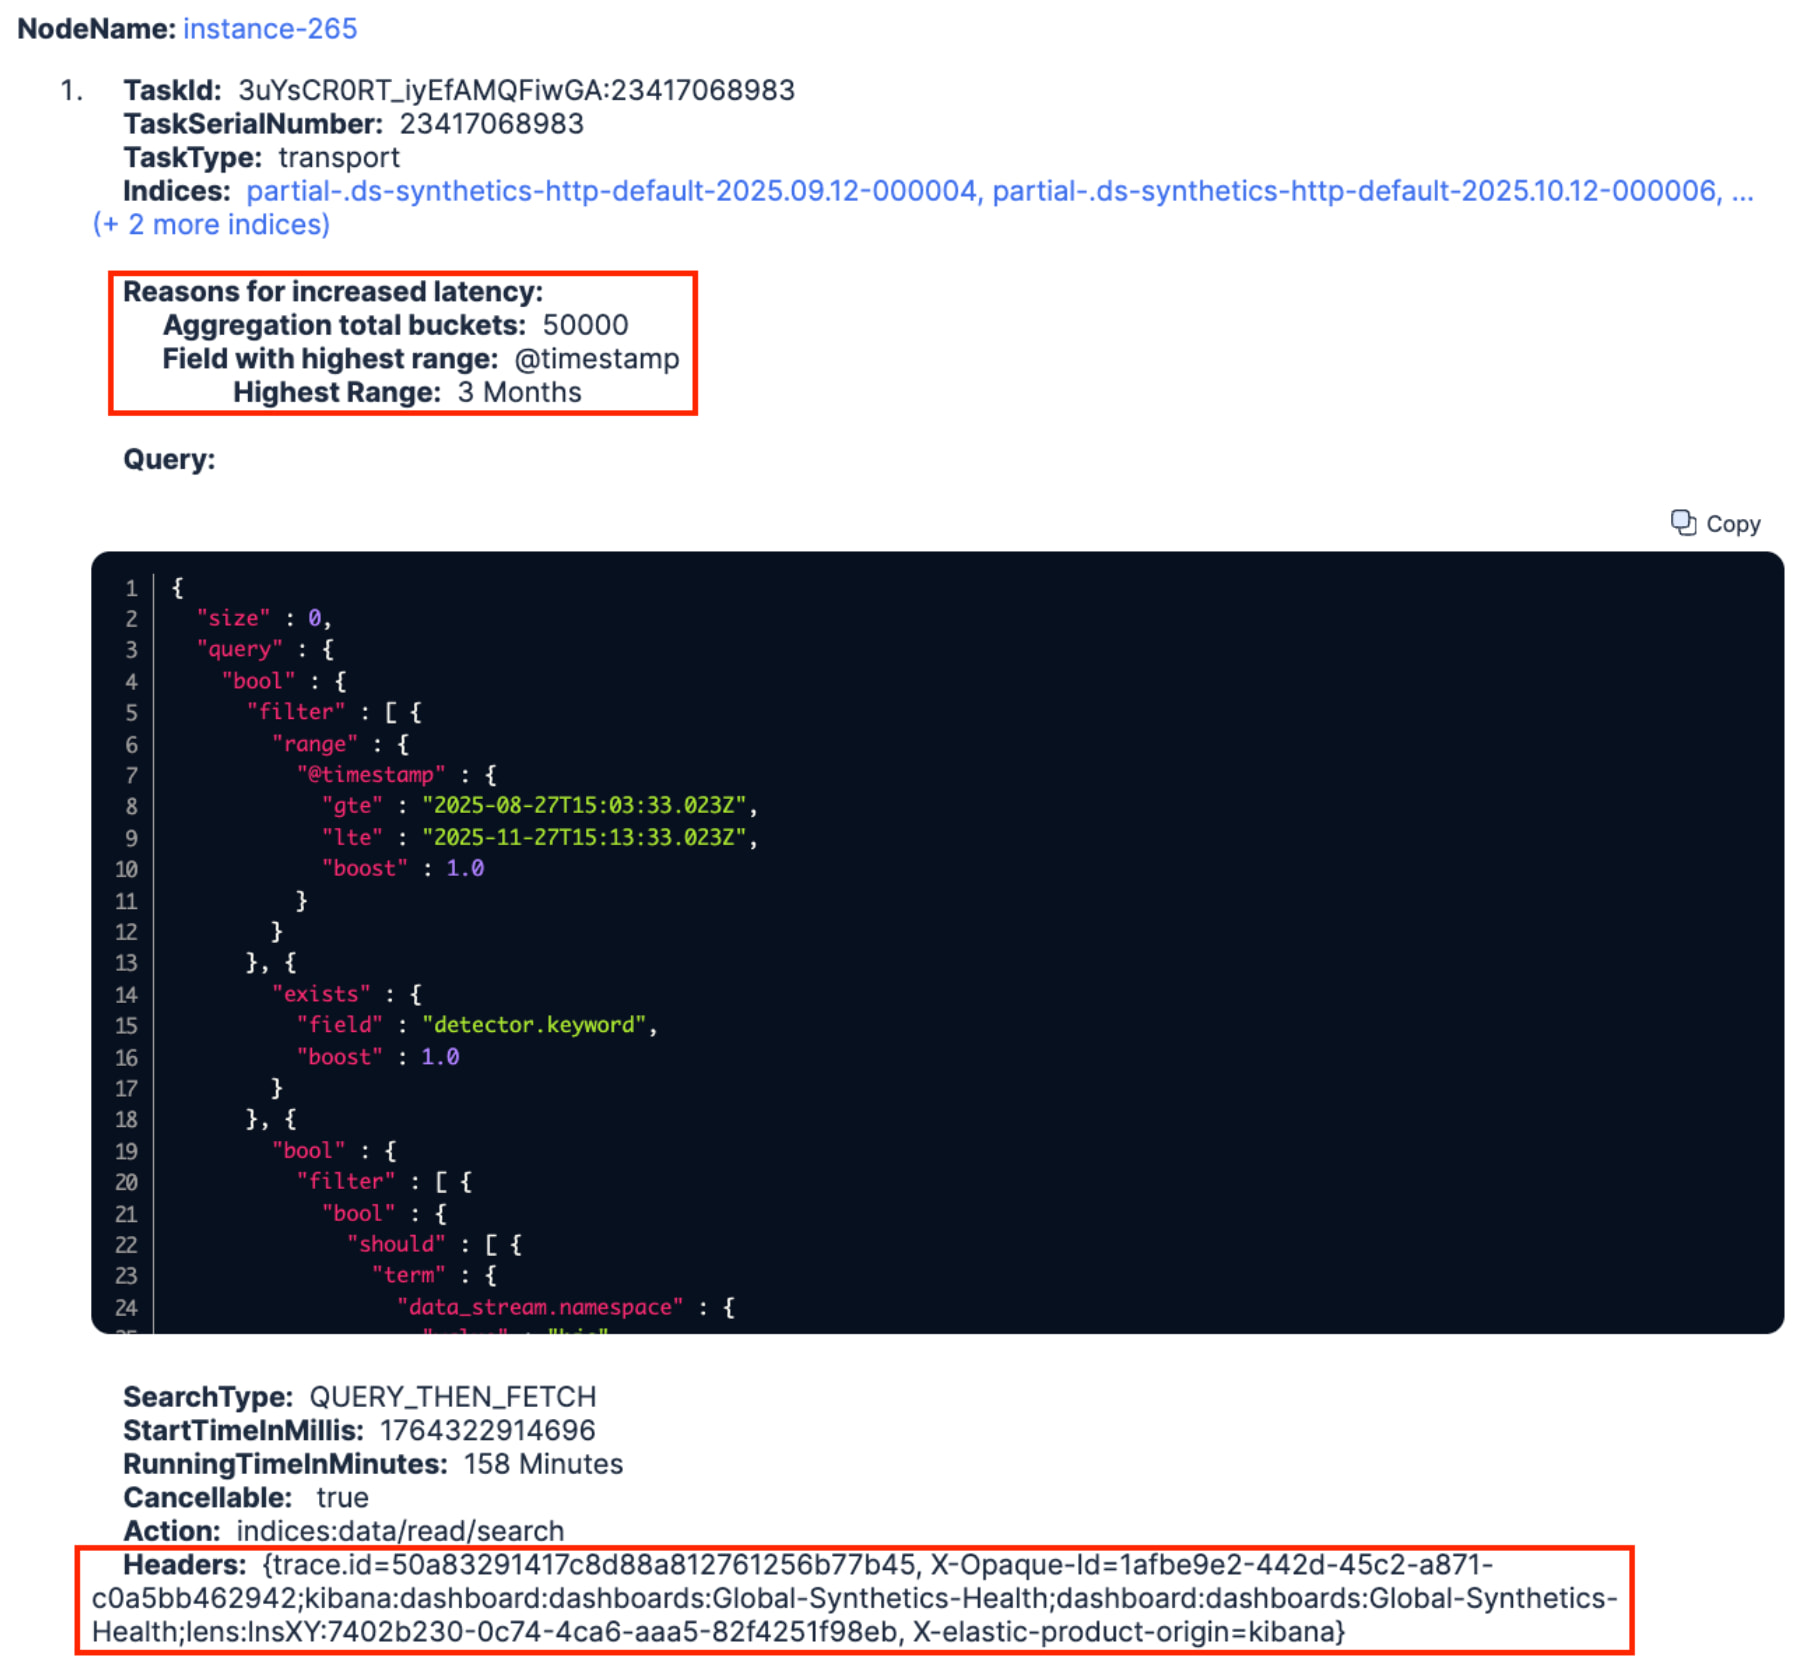
Furthermore, the X-Opaque-ID HTTP header revealed the ID of a dashboard named Global-Synthetics-Health that this query was originating from (highlighted in red above). Heading to that dashboard, we discovered that it contained a lot of Lens visualizations running on the same data views. That is not uncommon, but the three month time range saved with the dashboard didn’t really help at all, knowing that only one month of data was kept in the hot tier. We changed the time range to the last 10 days, killed the long-running query and our frozen tier immediately got a breather. Done ![]()
Wrapping up
Ok, let’s hold on for a second and recap what just happened? We had an urgent issue to solve and decided to leverage AutoOps as it keeps track of all recent events that it detected on our cluster. Knowing that an issue happening today can often be caused by one or more issues that happened earlier, the ability to correlate events and figure out how they cascade is paramount to understanding the root cause to attend to. In a matter of minutes, with the help of the Elastic Agent Builder running on top of AutoOps insights, we were able to get a quick and powerful guidance on what to focus on and how to do it. Our cluster is now breathing again, thanks to Elastic AI-powered AutoOps insights!
Granted, it isn’t perfect yet, there’s a lot to improve, but we were able to showcase that leveraging AI to correlate all those insights into actionable recommendations gets you quite a long way to heal your clusters. Stay tuned as we’ll make this happen in the very near future by introducing an AI Assistant in AutoOps.