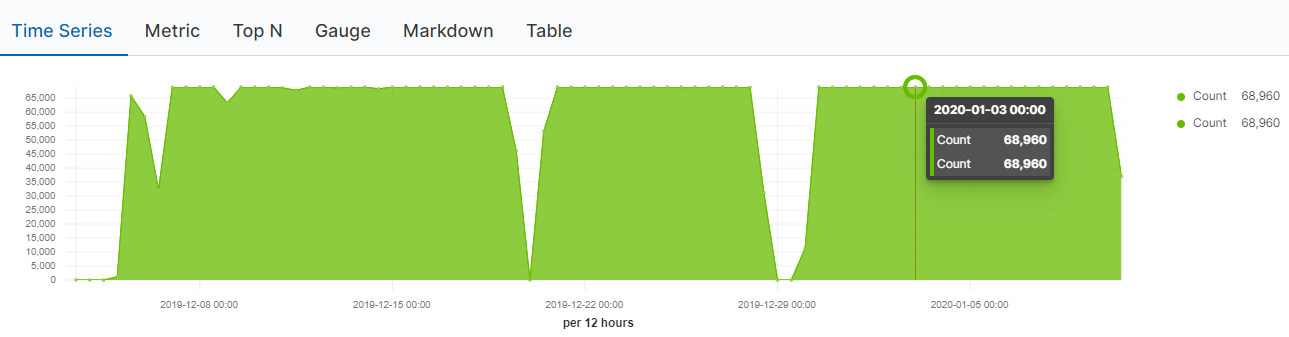
Hi! I am doing some dashboards for an iot device. The entries count for the respective index is diplayed in the following visual:
Can we create a percentage metric for the uptime of this device considering any selected time frame directly in kibana? Thanks
Hi @joaoantoniopereira2 I think so, I don't know much about your document structure, but I think you can find some useful hints in this tutorial: https://www.elastic.co/blog/how-to-display-data-as-a-percentage-in-kibana-visualizations
© 2020. All Rights Reserved - Elasticsearch
Apache, Apache Lucene, Apache Hadoop, Hadoop, HDFS and the yellow elephant logo are trademarks of the Apache Software Foundation in the United States and/or other countries.