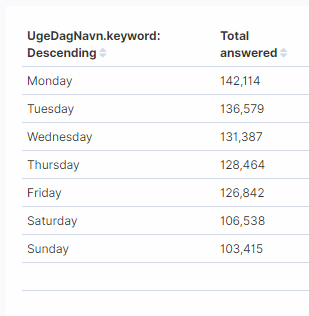
I am making some Kibana dashboards and would like to dynamically change which buckets I set in data tables and bar charts.
As example I need two views (I need more, but we'll keep it simple for now):
The first view has a count of total answered messages, grouped by the week day as bucket.

The second view has the same count, still grouped by week day, but now also grouped by user id.

As in reality I'm going to have ~8 possible grouping buckets, and the user might want to combine them in different ways, it would clutter the dashboard to make a data table and a bar plot for each of the possibilities.
So I ideally want a solution, where the user can click on a bucket and chose which buckets the visualizations should be grouped by. As far as I can see, this is not something the Control viz can do - it seems to be more focused on filtering on the individual values in the column and not on the entire column.
I don't know if this is even possible, but I can't imagine being the first to ever need this kind of functionality, so I hope someone has found a solution somehow.