dear Mr @stephenb,
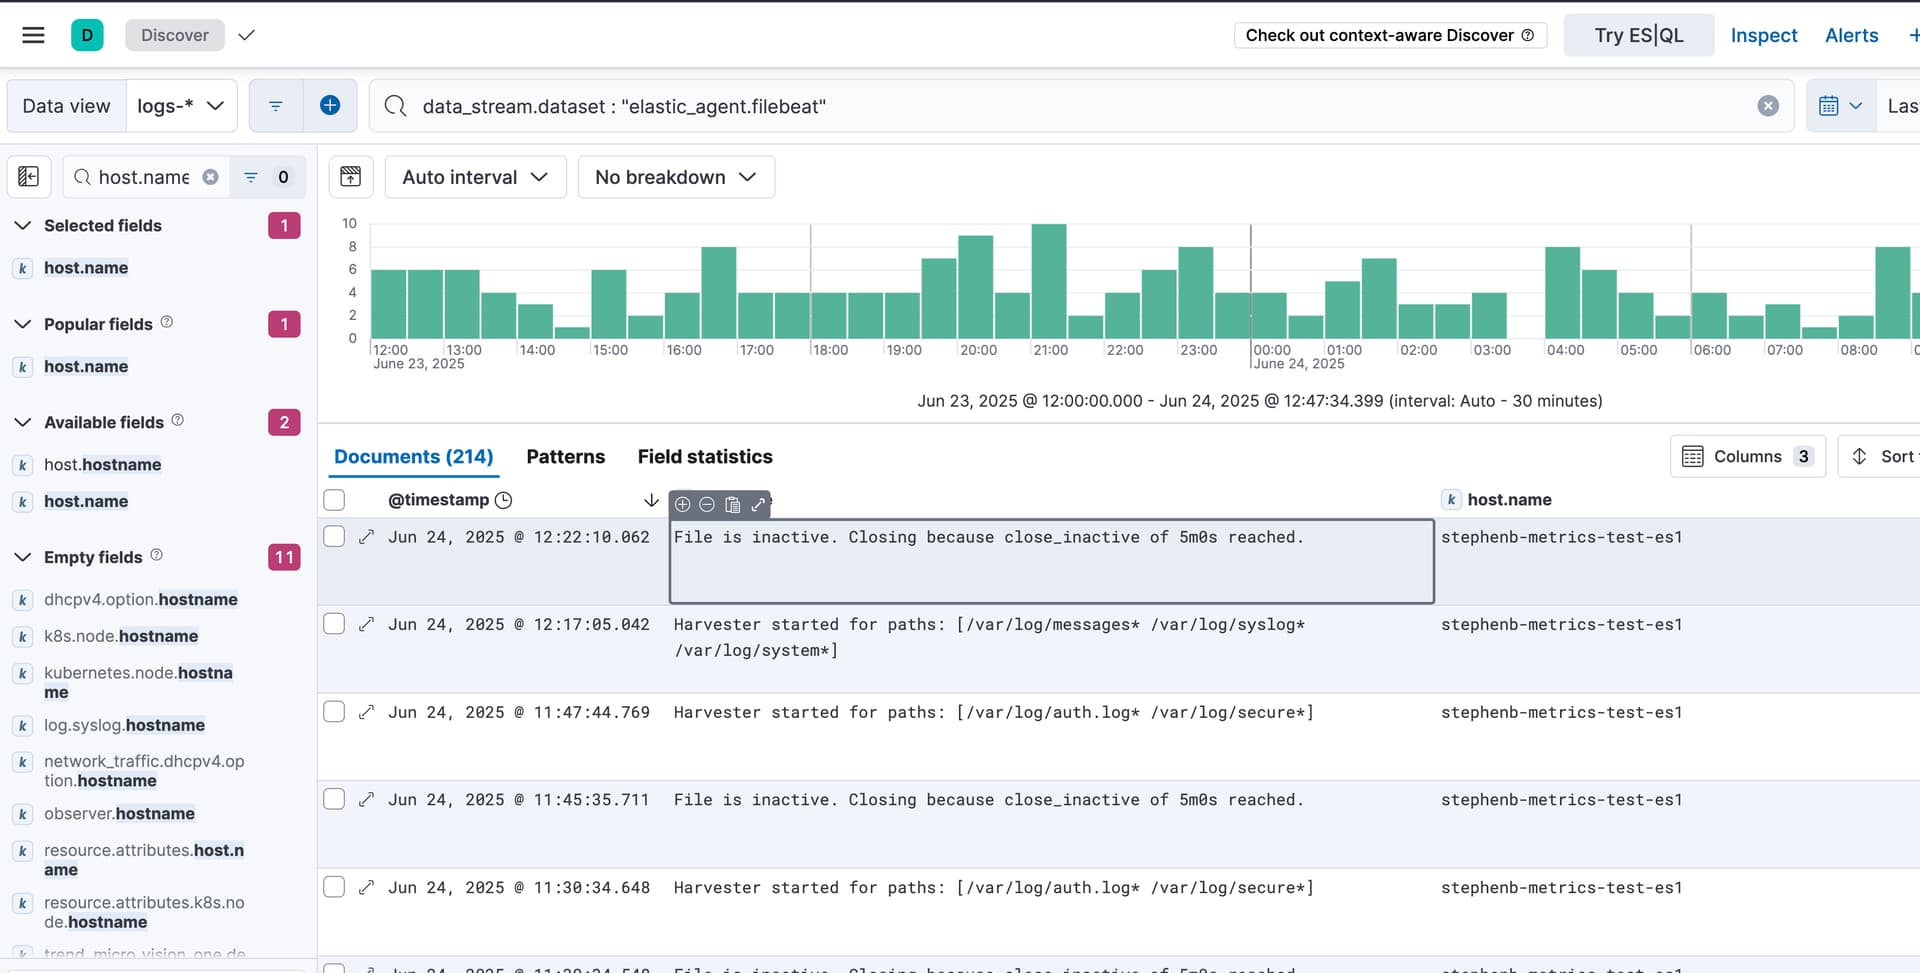
When i issue data_stream.dataset : "elastic_agent.filebeat" and host.name : "WIN-GGI5VI06VT1" i simply get "no results match criteria".
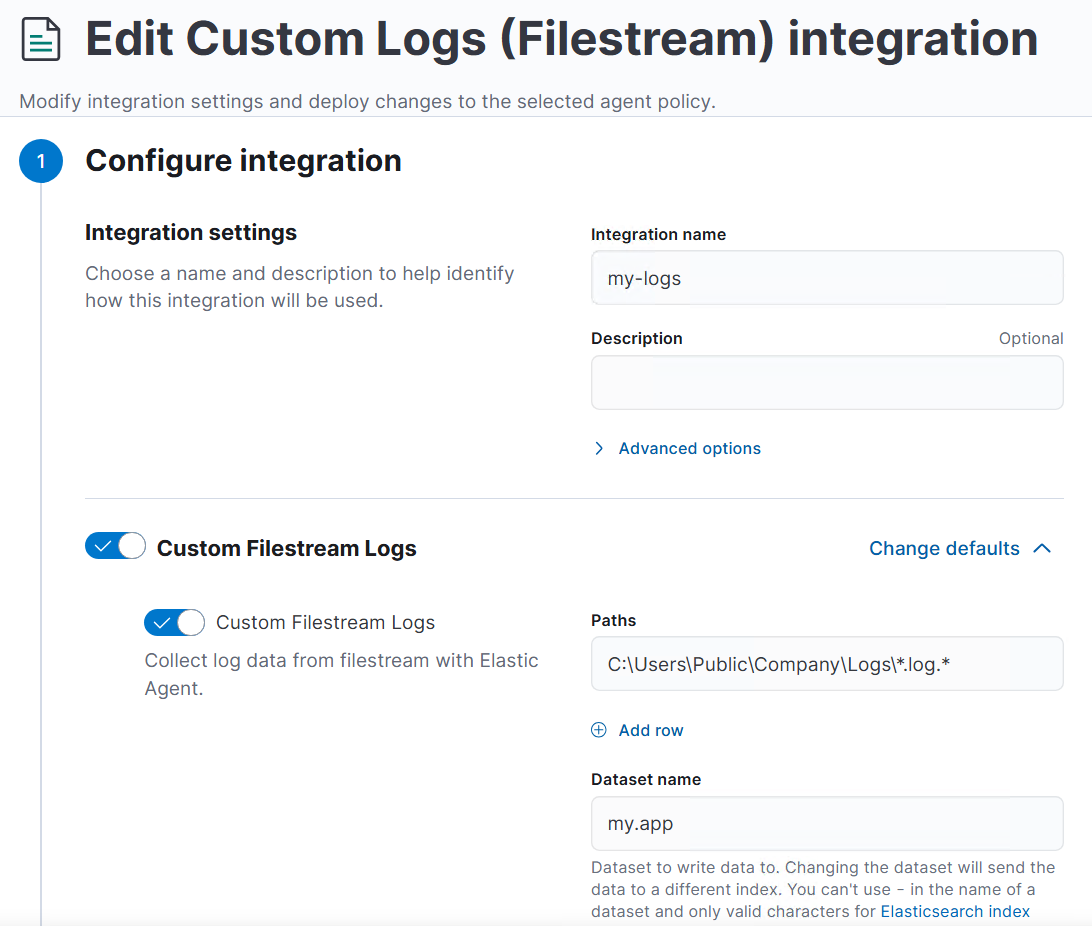
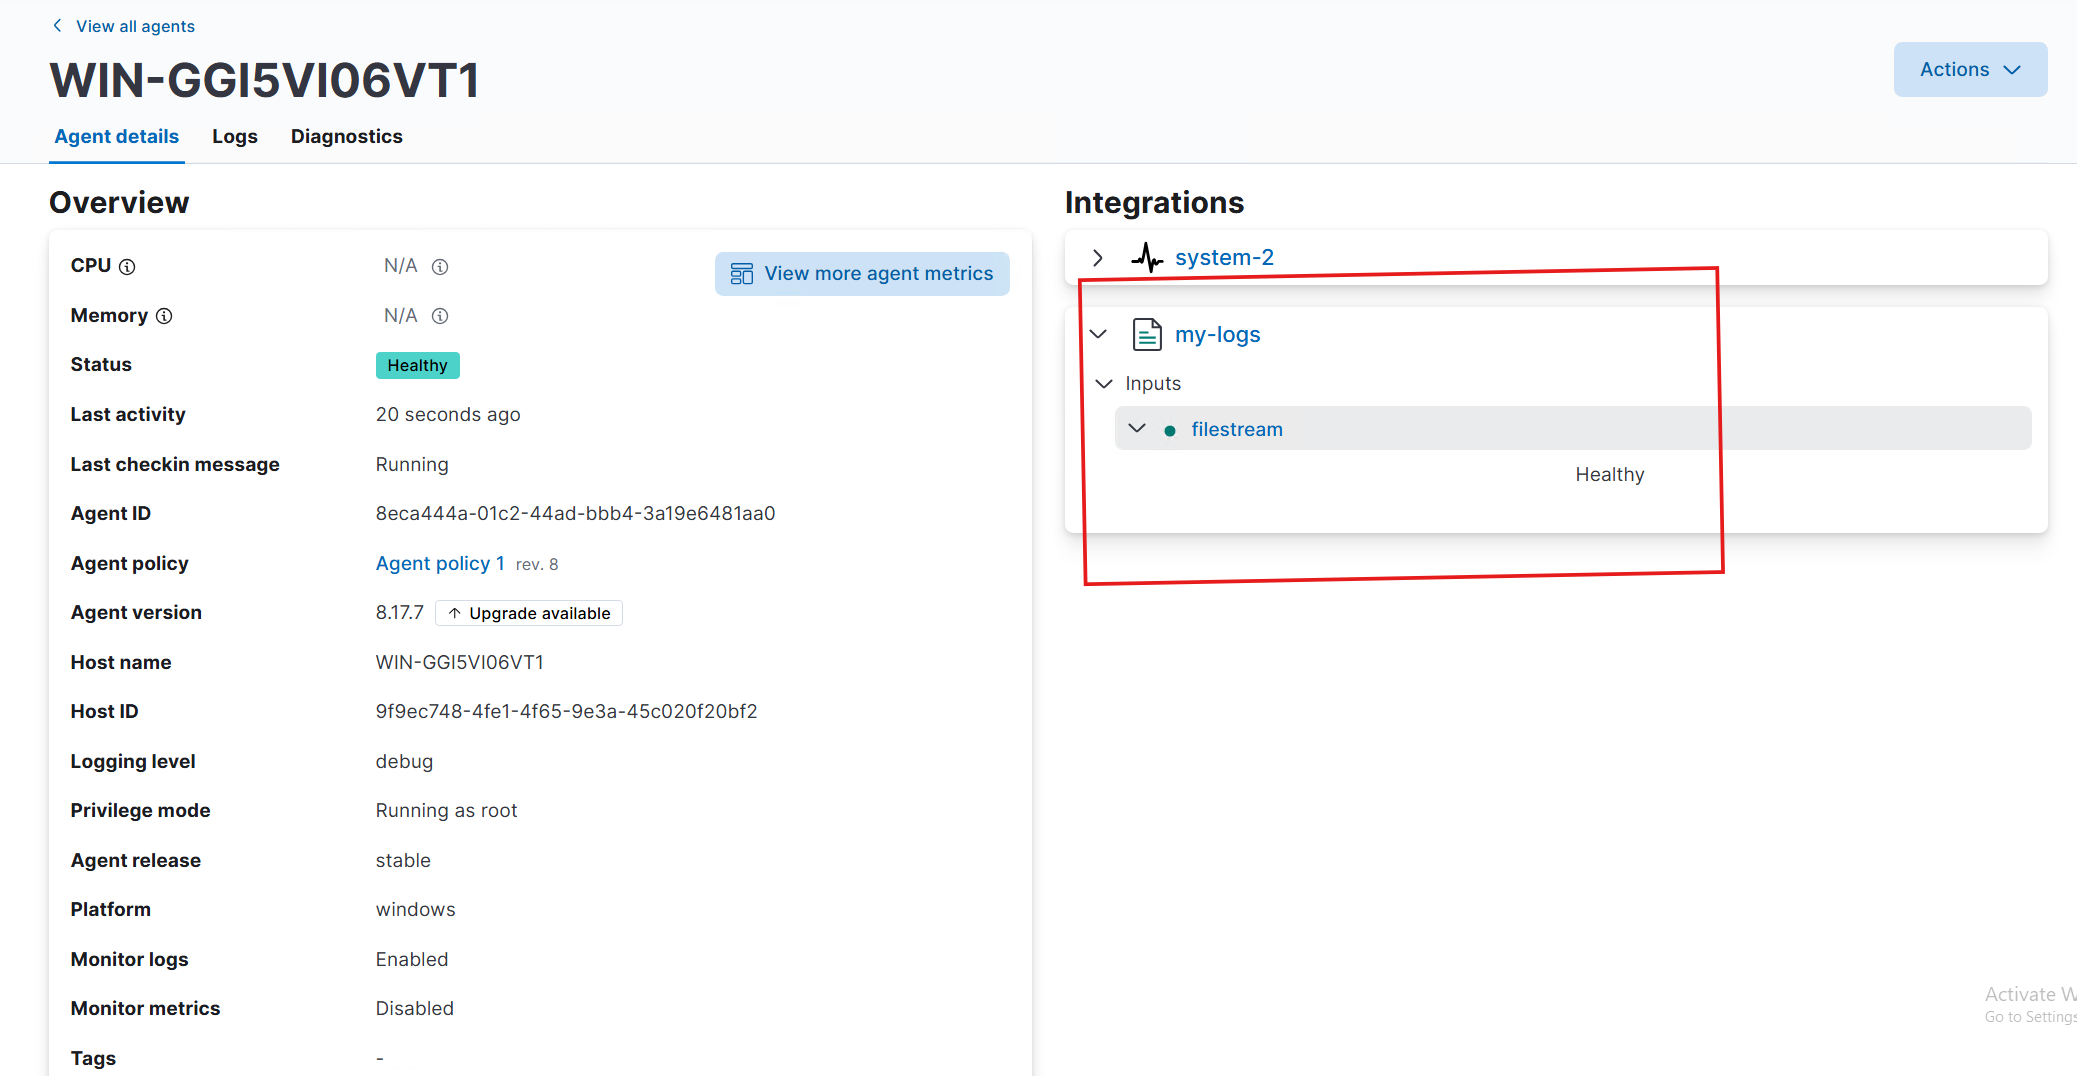
I went ahead and downloaded latest diagnostics file and verified that the Elastic Agent actually does successfully harvest my log files - i do see some actual log entries from my app in "message" field. Here is a sample containing a Warning-level log entry from my app about server connection failure, also indicating that this message supposedly should be delivered to logs-my.app-default index in Elasticsearch as per the raw_index field:
{"log.level":"debug","@timestamp":"2025-06-27T23:08:39.146+0300","message":"Publish event: {\n \"@timestamp\": \"2025-06-27T20:08:39.142Z\",\n \"@metadata\": {\n \"beat\": \"filebeat\",\n \"type\": \"_doc\",\n \"version\": \"8.17.7\",\n \"raw_index\": \"logs-my.app-default\",\n \"input_id\": \"filestream-filestream-edd8d5e0-ded1-4f27-bc1e-a5abc8094855\",\n \"stream_id\": \"filestream-filestream.generic-edd8d5e0-ded1-4f27-bc1e-a5abc8094855\"\n },\n \"data_stream\": {\n \"dataset\": \"my.app\",\n \"namespace\": \"default\",\n \"type\": \"logs\"\n },\n \"elastic_agent\": {\n \"snapshot\": false,\n \"version\": \"8.17.7\",\n \"id\": \"8eca444a-01c2-44ad-bbb4-3a19e6481aa0\"\n },\n \"agent\": {\n \"ephemeral_id\": \"546f44a4-3932-40d1-bf80-8db2591a6b79\",\n \"name\": \"WIN-GGI5VI06VT1\",\n \"id\": \"8eca444a-01c2-44ad-bbb4-3a19e6481aa0\",\n \"type\": \"filebeat\",\n \"version\": \"8.17.7\"\n },\n \"ecs\": {\n \"version\": \"8.0.0\"\n },\n \"host\": {\n \"hostname\": \"WIN-GGI5VI06VT1\",\n \"name\": \"win-ggi5vi06vt1\",\n \"architecture\": \"x86_64\",\n \"os\": {\n \"family\": \"windows\",\n \"name\": \"Windows Server 2022 Standard\",\n \"kernel\": \"10.0.20348.3207 (WinBuild.160101.0800)\",\n \"build\": \"20348.3207\",\n \"type\": \"windows\",\n \"platform\": \"windows\",\n \"version\": \"10.0\"\n },\n \"id\": \"9f9ec748-4fe1-4f65-9e3a-45c020f20bf2\",\n \"ip\": [\n \"fe80::2cb8:ab28:f449:9e06\",\n \"192.168.1.111\"\n ],\n \"mac\": [\n \"00-15-5D-01-B7-02\"\n ]\n },\n \"log\": {\n \"offset\": 0,\n \"file\": {\n \"path\": \"C:\\\\Users\\\\Public\\\\Company\\\\Logs\\\\dmskrnl.log\",\n \"idxhi\": \"28508160\",\n \"idxlo\": \"20882\",\n \"vol\": \"2389561806\",\n \"fingerprint\": \"a654f81b7a09cc6e64d103f660f8194b21736403f94e569361d6bb5098eee7c7\"\n }\n },\n \"message\": \"2025-06-27 22:52:48,950 WARN [0x0000306c] myapp.secevent - (112) Server connection failed secure handshake. User: . Target: . Client: 192.168.1.111:52179.\",\n \"input\": {\n \"type\": \"filestream\"\n },\n \"event\": {\n \"dataset\": \"my.app\"\n }\n}","component":{"binary":"filebeat","dataset":"elastic_agent.filebeat","id":"filestream-default","type":"filestream"},"log":{"source":"filestream-default"},"service.name":"filebeat","log.type":"event","ecs.version":"1.6.0","log.logger":"processors","log.origin":{"file.line":215,"file.name":"processing/processors.go","function":"github.com/elastic/beats/v7/libbeat/publisher/processing.debugPrintProcessor.func1"},"ecs.version":"1.6.0"}
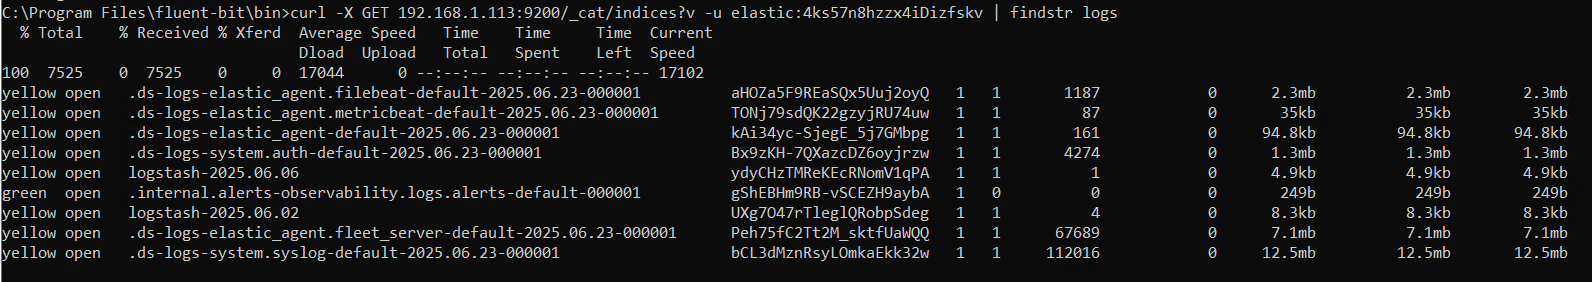
However, when i check all the existing log indexes in Elasticsearch, i do not see any mention of logs-my.app-default:
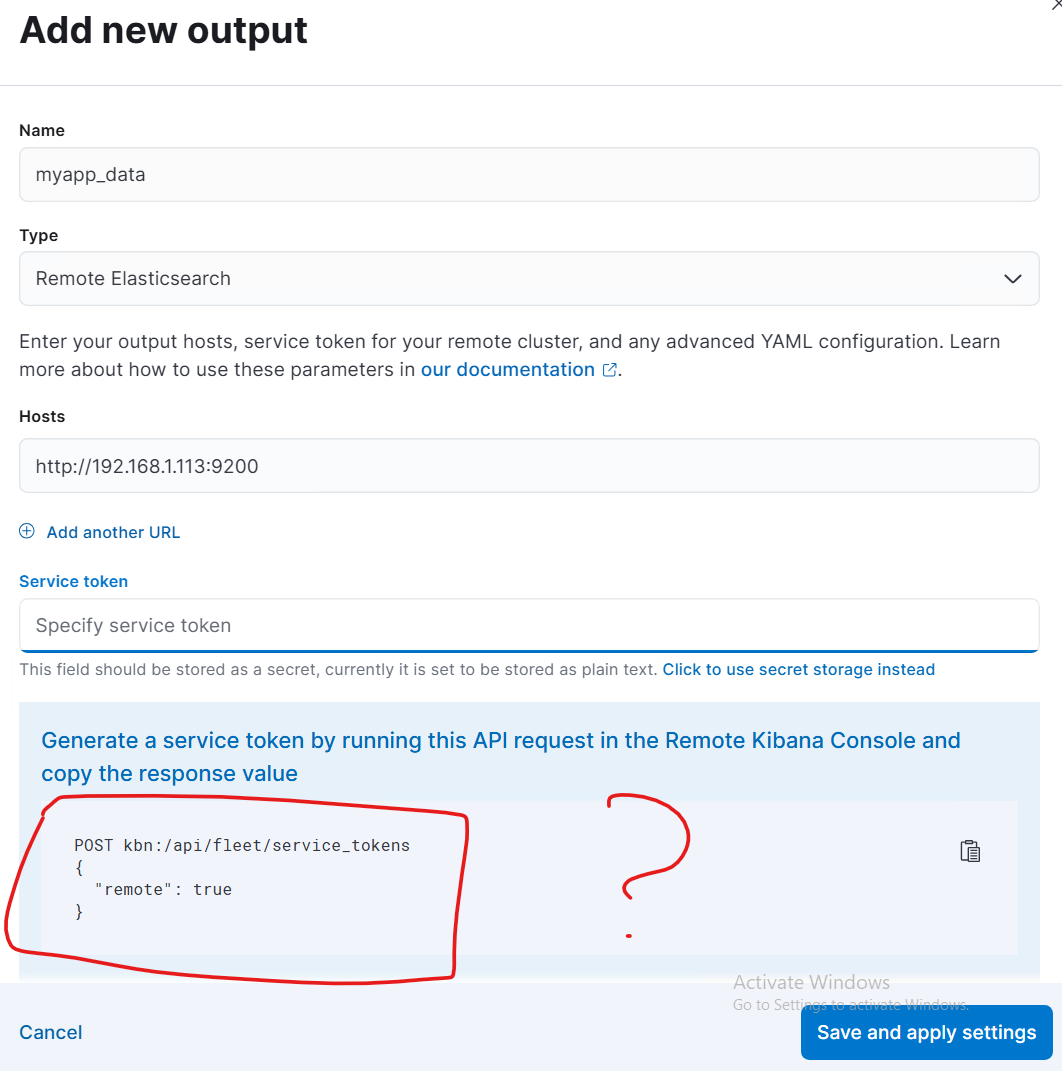
The problem then appears to be with the connection establishment of some sorts:
PS C:\Users\Administrator\elastic-agent-8.17.7-windows-x86_64> .\elastic-agent status
Error: failed to communicate with Elastic Agent daemon: rpc error: code = Unavailable desc = connection error: desc = "transport: Error while dialing: open \\\\.\\pipe\\B2kC2dS9J8fZ9F6omPD2JN1wibs4Yzc7.sock: The system cannot find the file specified."
For help, please see our troubleshooting guide at https://www.elastic.co/guide/en/fleet/8.17/fleet-troubleshooting.html
Also:
PS C:\Users\Administrator\elastic-agent-8.17.7-windows-x86_64> .\elastic-agent diagnostics
[WARNING]: failed to fetch agent diagnostics: error in DiagnosticAgent RPC call: rpc error: code = Unavailable desc = connection error: desc = "transport: Error while dialing: open \\\\.\\pipe\\B2kC2dS9J8fZ9F6omPD2JN1wibs4Yzc7.sock: The system cannot find the file specified."[WARNING]: failed to fetch unit diagnostics: rpc error: code = Unavailable desc = connection error: desc = "transport: Error while dialing: open \\\\.\\pipe\\B2kC2dS9J8fZ9F6omPD2JN1wibs4Yzc7.sock: The system cannot find the file specified."[WARNING]: failed to fetch component diagnostics: error in DiagnosticComponents RPC call: rpc error: code = Unavailable desc = connection error: desc = "transport: Error while dialing: open \\\\.\\pipe\\B2kC2dS9J8fZ9F6omPD2JN1wibs4Yzc7.sock: The system cannot find the file specified."Error: failed collecting diagnostics: no diags could be fetched
I tried to consult the troubleshooting guide which was kindly provided in the error message but was unable to procure any solution to this problem.
If it's of any importance, the TCP connection between my Linux and Windows machines is established via port 8220:
PS C:\Users\Administrator\elastic-agent-8.17.7-windows-x86_64> netstat -nat | findstr 8220
  TCP    192.168.1.111:58370    192.168.1.113:8220     ESTABLISHED     InHost