Elastic Agent with Custom Logs capturing mapping errors in event logs

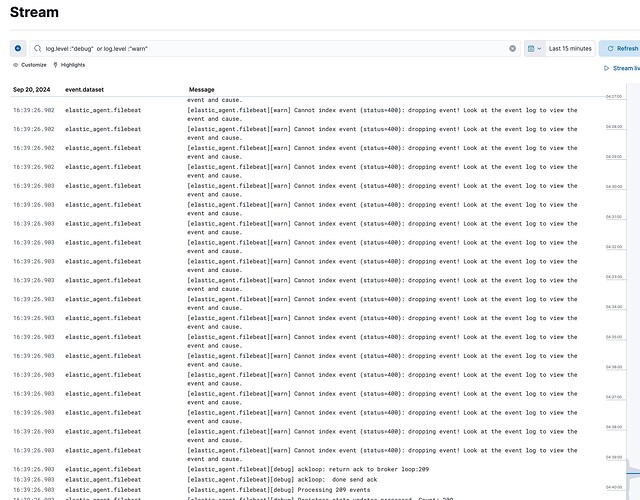
I have an elastic agent running in a docker container with a custom logs integration. The elastic agent generates this warning when ingesting logs:

2024-09-11 11:14:59 {"log.level":"warn","@timestamp":"2024-09-11T15:14:59.598Z","message":"Cannot index event (status=400): dropping event! Look at the event log to view the event and cause.","component":{"binary":"filebeat","dataset":"elastic_agent.filebeat","id":"log-default","type":"log"},"log":{"source":"log-default"},"log.logger":"elasticsearch","log.origin":{"file.line":488,"file.name":"elasticsearch/client.go","function":"github.com/elastic/beats/v7/libbeat/outputs/elasticsearch.(*Client).applyItemStatus"},"service.name":"filebeat","ecs.version":"1.6.0","ecs.version":"1.6.0"}

I found that the agent is logging locally to: /usr/share/elastic-agent/state/data/logs/

I also found the stream it is logging to.

In both locations I can find the above warning message. However, in neither location can I find more details nor the event log that is mentioned in the warning message. I have bumped the elastic agent logging to debug and I have found no useful information.

From other discussions I found out that status=400 refers to a mapping error. So when I inserted a document to the pipeline via console I got this error:

{
  "error": {
    "root_cause": [
      {
        "type": "document_parsing_exception",
        "reason": "[1:258] object mapping for [host] tried to parse field [host] as object, but found a concrete value"
      }
    ],
    "type": "document_parsing_exception",
    "reason": "[1:258] object mapping for [host] tried to parse field [host] as object, but found a concrete value"
  },
  "status": 400
}

My ingest pipeline has failure processors and they are not logging any information. Which makes sense since this looks to be a mapping error and not an ingest pipeline error.

I deduce that the Elastic Agent Custom Logs integration is generating those same errors. But I can find no evidence of them in any of the log files or streams for the agent.

Where would I find these error details so I can diagnose future errors?

Additionally what should I be monitoring to assure that logs are being fully ingested?

Hi @jeffabar yes the dreaded mapping conflict...

    "reason": "[1:258] object mapping for [host] tried to parse field [host] as object, but found a concrete value"

First, there is already host object because elastic agent creates and host is an ECS field so it already is defined so you can not just host to simple field.

Just rename your field from host to app_host or something and you should be fine

You can overwrite the ECS host.name field as well is that is what you desire..

can you provide a sample of your doc and you ingest pipeline?

My problem is not how to fix the error I know how to handle that. The problem is the logs I can find have no detail to help debug the problem.

This is the main part of the log entry on the Elastic Agent:
"Cannot index event (status=400): dropping event! Look at the event log to view the event and cause."

I cannot find this "event log" that is being referenced. The logs I found in /usr/share/elastic-agent/state/data/logs/ don't have any error message other than the generic 400 error message.

Only by luck did I find the document that caused the 400 error, so we need a more reliable method to identify what is causing the mapping error.

Hi @jeffabar

Yup mapping errors are hard to diagnose / find exact causes / which document..

This indicates there is the mapping error

"reason": "[1:258] object mapping for [host] tried to parse field [host] as object, but found a concrete value"

"Look at the event log to view the event and cause."

This means looking at the shipper / agent / integration, which is what you understand.

You can turn up the shipper log.level to debug and I believe it will show you the exact document that is failing.... and that is not the easiest to find either...

Go to the agent that is logging that error and turn the logs up to Debug

Kibana - Fleet - Agent -> Logs

Then, these logs should show the actual doc that is having the issue...

Try it let me know if that works...

Soon, there will be a failure store that they will go into to help this process... it will store the failed document, which then you can use to debug and decide what action ... that is on the near term roadmap but no formal release yet.

OK I gave that a try and changed the log level of the elastic agent for this to debug.

I am not seeing anything in the logs in elastic to provide extra detail:

However I did find the details in: /usr/share/elastic-agent/state/data/logs/events

As a side note it looks like the logs in that folder are only created when the agent is in debug level logging. I have not tested this extensively but it does not seem to populate them at info level etc.

How do I get those logs ingested into elastic so I can diganose issues on machines I don't have access to where the agent is running?

Also is there a ticket I can follow to keep up to date on failure store?

Where should I look for help on these two remaining areas?

failure_store perhaps see this...
Much of it is implemented but has broad impact so there is no single issues to track. Perhaps see here...

(it is actually in the code as of 8.15 believe)

I am pretty sure there will be a big announcement when it goes full BETA / GA

Regards to the other issue I would open a specific topic

1 Like