Hello,
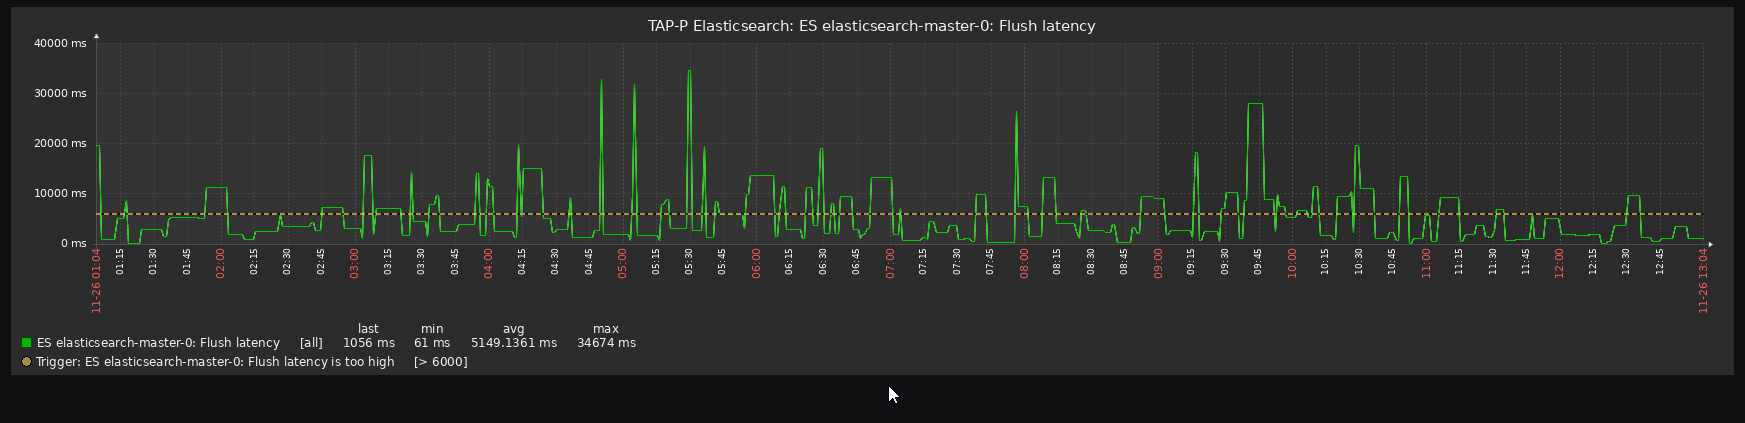
from zabbix monitoring im getting a lot of notifications fetch/flush latency is too high.
Are values within a margin or is it problem. In last 12 hours avg was 5000 ms max 34000ms
Would changing durability to async fix the issue? "index.translog.durability": "async"
my current settings
[elasticsearch@elasticsearch-master-0 ~]$ curl -k -u "${ELASTIC_USERNAME}:${ELASTIC_PASSWORD}" \
name flush.total flush.total_time
elasticsearch-master-0 2692 3.9h
elasticsearch-master-1 2699 4.2h
elasticsearch-master-2 2747 4.5hname heap.percent heap.current heap.max ram.current ram.max
elasticsearch-master-0 67 5.4gb 8gb 11.9gb 12gb
elasticsearch-master-1 67 5.4gb 8gb 11.9gb 12gb
elasticsearch-master-2 46 3.7gb 8gb 11.9gb 12gbname segments.count segments.memory merges.current
elasticsearch-master-0 624 28.9mb 2
elasticsearch-master-1 547 24.5mb 1
elasticsearch-master-2 579 25.6mb 1
[elasticsearch@elasticsearch-master-0 ~]$ curl -k -u "${ELASTIC_USERNAME}:${ELASTIC_PASSWORD}" \
"settings?include_defaults=true&pretty" | \
grep -A 5 "translog"
% Total % Received % Xferd Average Speed Time Time Time Current
Dload Upload Total Spent Left Speed
0 0 0 0 0 0 0 0 -::- -::- -::- 0 "translog" : {
"generation_threshold_size" : "64mb",
"flush_threshold_size" : "512mb",
"sync_interval" : "5s",
"retention" : {
"size" : "512MB",
–
image: **elasticsearch:7.10.1
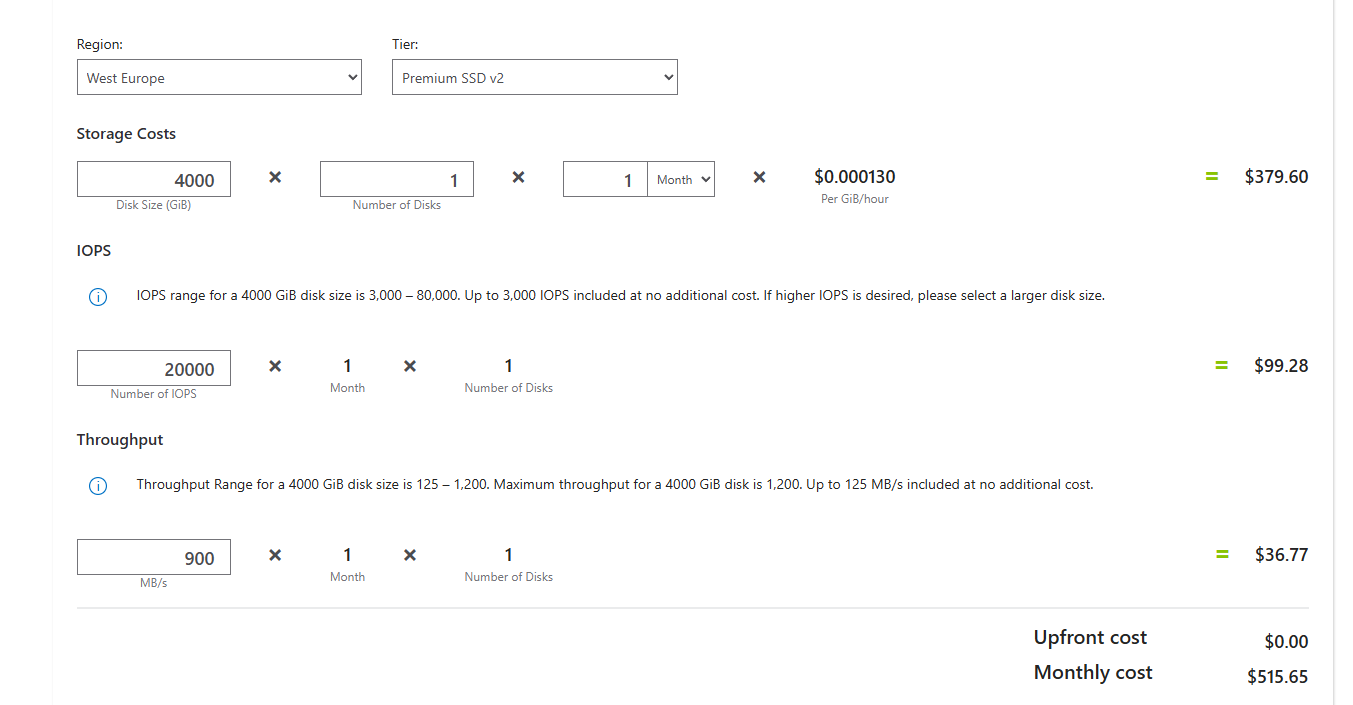
PVC** Size
4096 GiB
Storage type
Standard SSD LRS
      resources:

        limits:

          cpu: '2'

          memory: 12Gi

        requests:

          cpu: 100m

          memory: 4Gi
Thanks for help