Hi,
We are seeing unexpected write I/O on elasticsearch data nodes.
this is what is captured by iotop:
![]()
As you can see, the disk io is 100% all the time, following is captured detailed threads.

Here is the output of Iostat
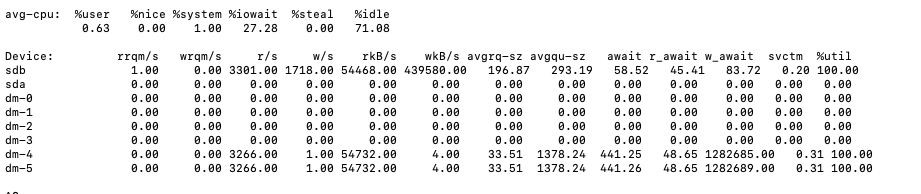
What we did:
- originally we had 3 master nodes, 5 data nodes, 3 coordinator nodes running in k8s version v1.16.6-beta.0 and docker version 18.9.7. All storage disks are premium ssds.
- Recently we added 5 data nodes to this cluster.
- We have a heavily read index which has 5 primary shards and each has 2 replicas.
- It worked find previously however, because of the growth of the size, we are observing performance downgrade very slowly. that's why we are trying to scale up the data nodes.
- as you can see, the newly added nodes have rediculously high read disk io. Top 20 threads are elasticsearch.....
Can any1 figure out what can be the potential reason?? thank you so much in advance.
