Yes, I meant Kibana -> Dev Tools -> Console Tab
Well I ran - GET /_data_stream/.ds-filebeat-8.12.0-2024.02.06-000001 because I was facing some errors when I tried GET filebeat-*/_search the first time, so I tried
viewing all the indices. I saw that this .ds-filebeat-8.12.0-2024.02.06-000001 was a datastream, so I searched the Elasticsearch documentation and found this command: GET /_data_stream.
I ran that to get this result:
{
"data_streams": []
}
I assumed the result meant that the index was empty. However now when I run GET filebeat-*/_search it works fine and all the documents are visible. The errors I saw were probably due to some errors I did when I was running Filebeats the other day.
When you go to Discover and Use the filebeat-* Data view do you see your data?
When you open a document does it look fully parsed?
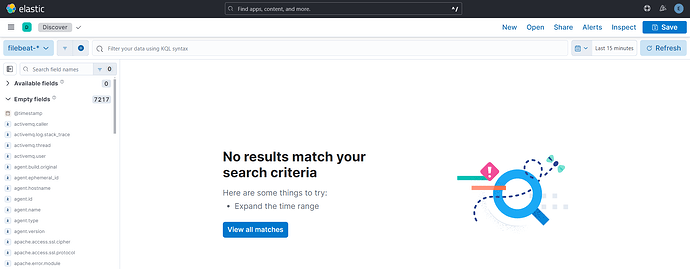
As I mentioned before, on my Discover page, the filebeat-* data view just shows empty fields as seen in this image:
Exactly Which Dashboards? Can you show? What do they look like, do you have the correct time range?
I was viewing the Dashboards -> Editing [Filebeat Nginx] Access and error logs ECS.
I've refreshed the time range multiple times and the Discover/Dashboard view does not change.
Also can you run
GET filebeat-*/_searchand show a full document of an access log, not just a snippet?
You could share a couple of the raw log lines and we might be able to check.
Sure, here are some of the raw log lines from the nginx/access.log and a full document of an access log in filebeat-*:
Log Lines from nginx/access.log:
127.0.0.1 - - [12/Feb/2024:10:48:12 +0530] "GET / HTTP/1.1" 200 615 "-" "Mozilla/5.0 (Windows NT 10.0; Win64; x64) AppleWebKit/537.36 (KHTML, like Gecko) Chrome/121.0.0.0 Safari/537.36"
127.0.0.1 - - [12/Feb/2024:10:48:12 +0530] "GET /favicon.ico HTTP/1.1" 404 555 "http://localhost/" "Mozilla/5.0 (Windows NT 10.0; Win64; x64) AppleWebKit/537.36 (KHTML, like Gecko) Chrome/121.0.0.0 Safari/537.36"
Full document of access log from filebeat-*:
{
        "_index": ".ds-filebeat-8.12.0-2024.02.06-000001",
        "_id": "0MJIso0BmY7W8rCq6hbx",
        "_score": 1,
        "_source": {
          "agent": {
            "name": "$LAPTOP NAME",
            "id": "$ID",
            "ephemeral_id": "$EPHEMERAL_ID",
            "type": "filebeat",
            "version": "8.12.0"
          },
          "nginx": {
            "access": {
              "remote_ip_list": [
                "127.0.0.1"
              ]
            }
          },
          "log": {
            "file": {
              "path": """C:\Program Files\nginx-1.25.3\logs\access.log"""
            },
            "offset": 0
          },
          "source": {
            "address": "127.0.0.1",
            "ip": "127.0.0.1"
          },
          "fileset": {
            "name": "access"
          },
          "url": {
            "path": "/",
            "original": "/"
          },
          "input": {
            "type": "log"
          },
          "@timestamp": "2024-02-12T05:18:12.000Z",
          "ecs": {
            "version": "1.12.0"
          },
          "_tmp": {},
          "related": {
            "ip": [
              "127.0.0.1"
            ]
          },
          "service": {
            "type": "nginx"
          },
          "host": {
            "hostname": "$LAPTOP_NAME",
            "os": {
              $OS_DETAILS
            },
            "ip": [
             $IP_DETAILS
            ],
            "name": "$LAPTOP_NAME",
            "id": "$ID",
            "mac": [
             $MAC_ADDR_DETAILS
            ],
            "architecture": "x86_64"
          },
          "http": {
            "request": {
              "method": "GET"
            },
            "response": {
              "status_code": 200,
              "body": {
                "bytes": 615
              }
            },
            "version": "1.1"
          },
          "event": {
            "ingested": "2024-02-16T14:18:59.560536200Z",
            "original": "127.0.0.1 - - [12/Feb/2024:10:48:12 +0530] \"GET / HTTP/1.1\" 200 615 \"-\" \"Mozilla/5.0 (Windows NT 10.0; Win64; x64) AppleWebKit/537.36 (KHTML, like Gecko) Chrome/121.0.0.0 Safari/537.36\"",
            "timezone": "+05:30",
            "created": "2024-02-16T14:18:46.548Z",
            "kind": "event",
            "module": "nginx",
            "category": [
              "web"
            ],
            "type": [
              "access"
            ],
            "dataset": "nginx.access",
            "outcome": "success"
          },
          "user_agent": {
            "original": "Mozilla/5.0 (Windows NT 10.0; Win64; x64) AppleWebKit/537.36 (KHTML, like Gecko) Chrome/121.0.0.0 Safari/537.36",
            "os": {
              "name": "Windows",
              "version": "10",
              "full": "Windows 10"
            },
            "name": "Chrome",
            "device": {
              "name": "Other"
            },
            "version": "121.0.0.0"
          }
        }
      }
