Elasticsearch Segment Merge Impacting Search Performance

We are looking for some guidance from the Elasticsearch community on a performance issue we are facing.

We have a 3-node Elasticsearch cluster running on Azure, with approximately 250 GB Premium SSD per node.

Our workload is quite write-heavy:

  • 6–7 million new documents ingested every day
  • A large number of updates
  • A large number of deletes
  • Search queries are running continuously alongside these operations

What we are seeing

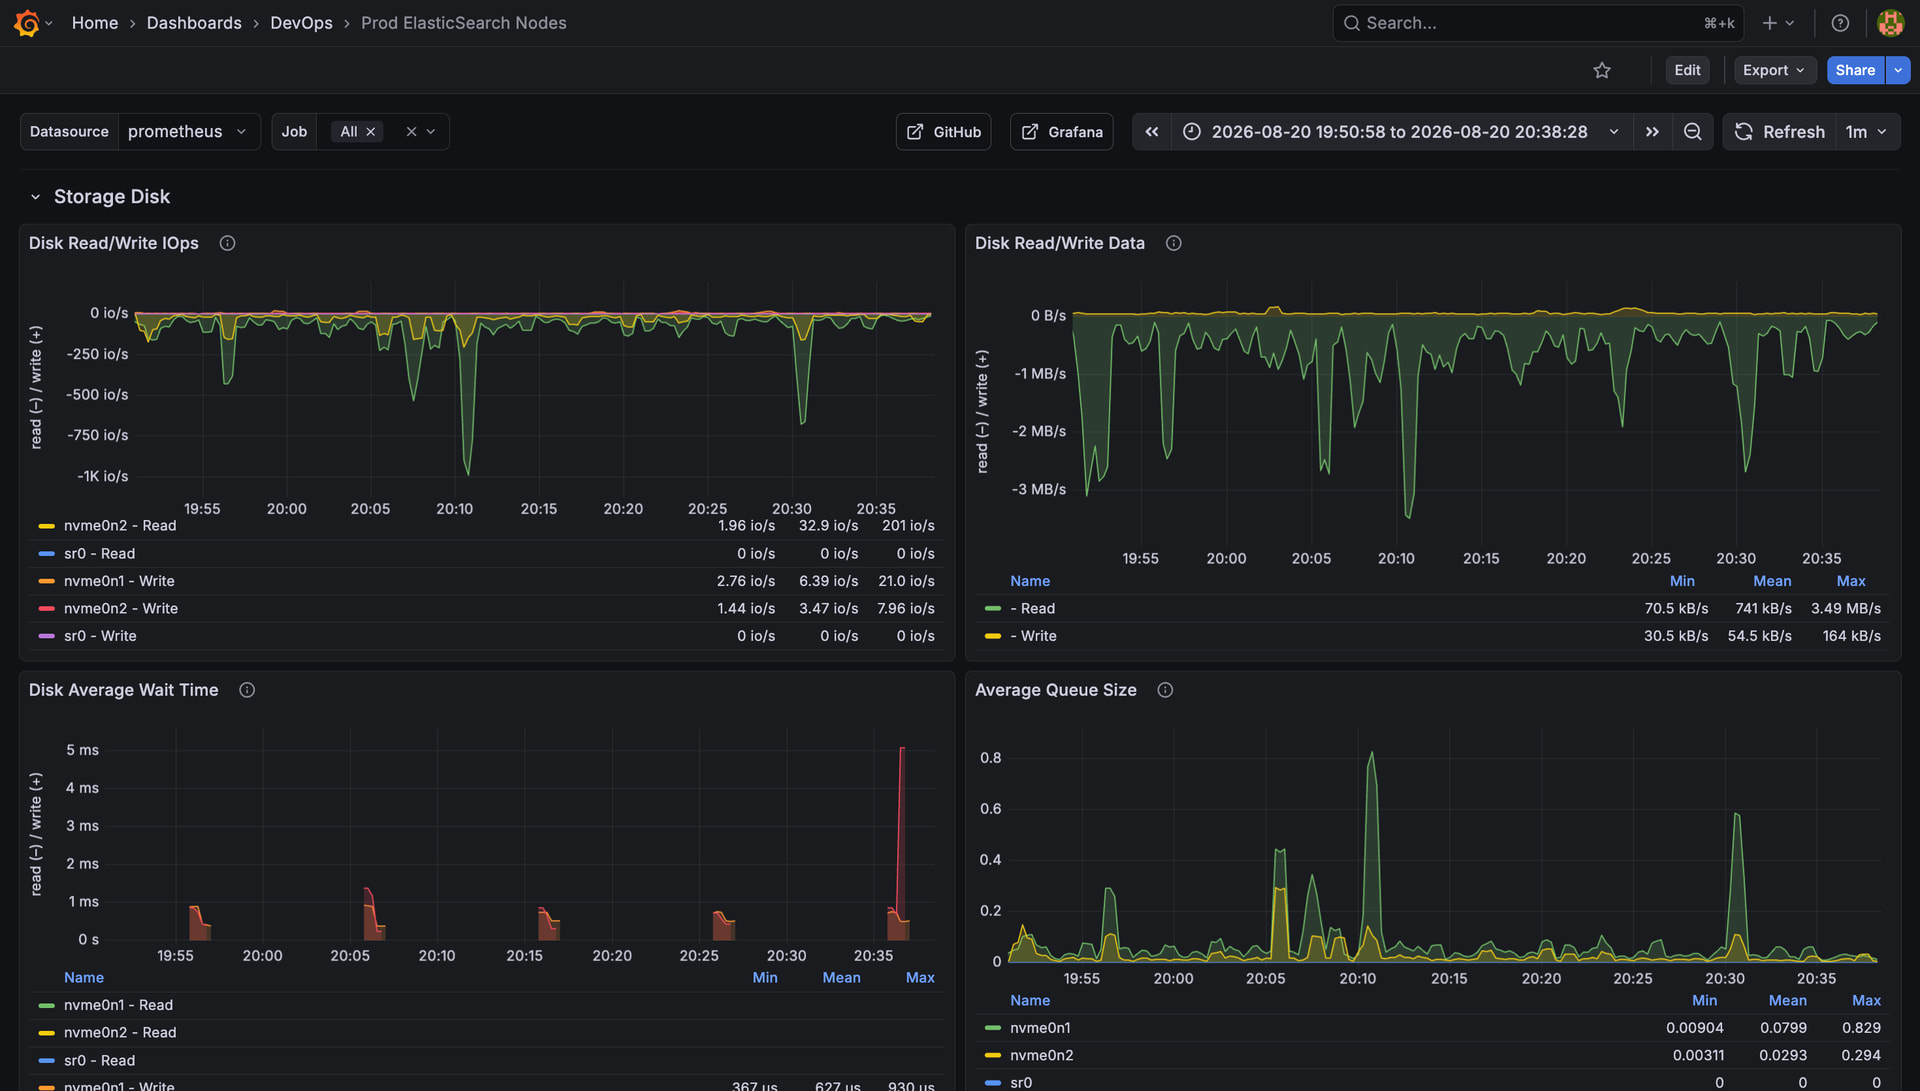
During periods of heavy indexing, updating, and deleting, we see significant Lucene segment merging.

When the merge activity becomes heavy:

  • Disk IOPS increases significantly
  • CPU usage reaches close to 100%
  • Merge activity continues for a long period
  • Search query performance degrades significantly

Our normal search latency is around 200–300 ms, but during heavy segment merging it increases to around 3–4 seconds.

Once the merge activity settles down, search performance returns to normal.

What we are trying to understand

Our current assumption is that the high volume of indexing + updates + deletes is generating a large number of Lucene segments, and the resulting merge activity is consuming significant CPU and disk I/O.

We would really appreciate suggestions from people who have operated Elasticsearch with similar high-write workloads.

What would you recommend in this situation?

  • Should we tune the Lucene/Elasticsearch merge policy?
  • Are there specific merge settings we should investigate?
  • Should we change our index/shard strategy?
  • Would rollover or time-based indices help?
  • Is there a better way to handle frequent updates/deletes?
  • Should we increase Azure disk IOPS/throughput?
  • What metrics should we monitor to confirm that merge pressure is the actual bottleneck?
  • Are there architectural approaches that can keep search latency stable while continuing to ingest 6–7M documents/day?

We are mainly looking for practical recommendations and experiences from anyone who has dealt with similar segment merge pressure in production.

Any suggestions, benchmarks, or approaches you recommend would be very helpful.

Hi @Dhruv_Mavani

Welcome to the community and Excellent Post and Question

First What version of the stack?

2nd, Before we get into details can you provide the exact machine type, size, ram, CPU in azure you are using? And exactly the storage type Premium SSD v1 / v2 etc
(Also it would help it you provided the region because there may be a more suitable vm type)

3rd what setting have you already changed from the base line.

6-7 M docs a day + updates + deletes is not huge not trivial but you also did not describe the total data set. But yes I suspect you are generating quite a few segments.

You also did not describe the index configuration / settings for that index, number of shards , refresh etc.etc.

I have run into some similar issues ... so lets get started with that and see where we get.

To greatly simplify we should look at the HW and index architecture (per @RainTown) first before trying to tweak a bunch of merge settings which are usually pretty good OOTB.

Also welcome to the forum @Dhruv_Mavani

In addition to what @stephenb asked, I note:

OK, but those documents go into a weekly/daily/hourly time based index, a data stream, a monolithic "all-our-stuff" index (if so, how big is it?), ... ?

How large is "a large number"? In same order of new docs, much less, or is (eg) each doc updated on average 5 or 10 times in its lifecycle, or ... ?

And, in passing, consider if there is any way you can reduce the number of updates/deletes? Depending on the use case, that can make quite a significant difference!

Have you looked at the segments and merges stats from /_stats ( or the relevant /{index}/_stats )? The segment count, current merge activity, and cumulative merge time should give you evidence to either confirm or refute that theory. eg I’d be curious how the underlying index's segment count changes over time?

See here

btw, 7 million docs / day is less than 100 docs / second. I wouldn’t normally describe that as a "high-write workload". As interesting a question, IMO, is how that compares with the volume of updates/deletes, how large/complex are the documents?

@stephenb @RainTown Thanks for the detailed questions. Sharing the complete setup and workload details below.

1. Elasticsearch Version & Azure Region

  • Elasticsearch: 9.0.8

  • Kibana: Docker container

  • Azure Region: Central India

2. Elasticsearch Cluster Infrastructure

We have a 3-node Elasticsearch cluster in Azure. Each node is a Master + Data + Ingest node.

Elasticsearch Nodes

Each node has:

  • VM: Standard E2as v6

  • CPU: 2 vCPUs

  • Memory: 16 GiB RAM

  • OS Disk: Standard SSD LRS

    • Size: 30 GB

    • IOPS: 500

    • Throughput: 100 MB/s

  • Data Disk: Premium SSD v2 LRS

    • Size: 250 GB

    • IOPS: 3,000

    • Throughput: 125 MB/s

JVM heap is configured to 4 GB on each node.

Kibana

We have one separate VM dedicated to Kibana:

  • VM: Standard B1ms

  • CPU: 1 vCPU

  • Memory: 2 GiB

  • Disk: Standard SSD LRS

    • Size: 30 GB

    • IOPS: 500

    • Throughput: 100 MB/s

So the complete setup is:

3 Elasticsearch VMs + 1 Kibana VM = 4 VMs

3. Elasticsearch Docker Setup

Elasticsearch and Kibana are running as Docker containers.

The directory structure on each Elasticsearch node is:

/opt/elasticsearch/
├── Dockerfile
├── docker-compose.yml
└── config/
    └── certs/
        ├── elastic-certificates.p12
        └── elastic-stack-ca.p12

The config directory currently contains only the certificates required for Elasticsearch security/TLS.

Dockerfile

FROM docker.elastic.co/elasticsearch/elasticsearch:9.0.8

# Add any custom plugin installations here if needed

docker-compose.yml

services:
  elasticsearch:
    build:
      context: .
      dockerfile: Dockerfile

    container_name: artha-es-node-1

    restart: unless-stopped

    environment:
      - node.name=artha-es-node-1
      - cluster.name=artha-es-cluster
      - node.roles=master,data,ingest,remote_cluster_client

      - discovery.seed_hosts=10.60.0.5,10.60.0.6

      - cluster.initial_master_nodes=artha-es-node-1,artha-es-node-2,artha-es-node-3

      - ES_JAVA_OPTS=-Xms4g -Xmx4g

      - bootstrap.memory_lock=true

      - xpack.security.enabled=true
      - xpack.security.transport.ssl.enabled=true
      - xpack.security.transport.ssl.verification_mode=certificate
      - xpack.security.transport.ssl.keystore.path=certs/elastic-certificates.p12
      - xpack.security.transport.ssl.truststore.path=certs/elastic-certificates.p12

      - network.publish_host=10.60.0.4

      - reindex.remote.whitelist=2x.x.x.x:9200

    ulimits:
      memlock:
        soft: -1
        hard: -1

      nofile:
        soft: 65536
        hard: 65536

    volumes:
      - es-data:/usr/share/elasticsearch/data
      - es-logs:/usr/share/elasticsearch/logs
      - /opt/elasticsearch/config/certs/elastic-certificates.p12:/usr/share/elasticsearch/config/certs/elastic-certificates.p12:ro

    ports:
      - "9200:9200"
      - "9300:9300"

    mem_limit: 10g
    memswap_limit: 10g

    logging:
      driver: json-file
      options:
        max-size: "50m"
        max-file: "3"

volumes:
  es-data:
  es-logs:

The configuration is the same on the other two nodes, with the corresponding node name and IP changed.

4. Current Index Sizes

The current index sizes are approximately:

index                                  docs.count      store.size

artha_jobs                              7,714,557        99.7 GB
artha_archived_jobs                    41,420,000        97.1 GB
artha_job_content_vectors_v2            1,633,255        19.7 GB
artha_job_content_vectors_us            2,737,271        10.6 GB
artha_job_content_vectors_v3            2,239,325         4.3 GB
artha_job_content_vectors_au              963,064         3.7 GB
artha_job_content_vectors_gb              268,186         1.0 GB
artha_job_content_vectors_de              234,887       959.5 MB
artha_job_content_vectors_in               49,389       764.9 MB
artha_job_content_vectors_it              151,350       658.8 MB
artha_job_vector_orphans_v1             1,288,145       331.3 MB
artha_job_content_vectors_ca               69,064       297.4 MB
artha_job_content_vectors_ae                6,050        24.5 MB
artha_job_content_vectors_es                  927         4.4 MB
artha_job_content_vectors_uk                   10       271.8 KB

The main workload is on the artha_jobs index.

5. Index Configuration

We have not intentionally changed the Lucene merge settings from their defaults.

We can provide the complete output of:

GET /artha_*/_settings?flat_settings=true

{
  "artha_job_content_vectors_it": {
    "settings": {
      "index.creation_date": "1785866058285",
      "index.number_of_replicas": "1",
      "index.number_of_shards": "1",
      "index.provided_name": "artha_job_content_vectors_it",
      "index.routing.allocation.include._tier_preference": "data_content",
      "index.uuid": "NFf0iFZhTIKSbWPb5NZM_g",
      "index.version.created": "9009000"
    }
  },
  "artha_job_vector_orphans_v1": {
    "settings": {
      "index.creation_date": "1785412992758",
      "index.number_of_replicas": "1",
      "index.number_of_shards": "1",
      "index.provided_name": "artha_job_vector_orphans_v1",
      "index.routing.allocation.include._tier_preference": "data_content",
      "index.uuid": "ibg5cdv6TpSz3CFoGo_hWw",
      "index.version.created": "9009000"
    }
  },
  "artha_jobs": {
    "settings": {
      "index.creation_date": "1784627760955",
      "index.number_of_replicas": "1",
      "index.number_of_shards": "3",
      "index.provided_name": "artha_jobs",
      "index.refresh_interval": "60s",
      "index.routing.allocation.include._tier_preference": "data_content",
      "index.translog.durability": "request",
      "index.uuid": "5q_wb0-qQ-m8h4ZzHHo-kQ",
      "index.version.created": "9009000"
    }
  },
  "artha_job_content_vectors_es": {
    "settings": {
      "index.creation_date": "1785855848534",
      "index.number_of_replicas": "1",
      "index.number_of_shards": "1",
      "index.provided_name": "artha_job_content_vectors_es",
      "index.routing.allocation.include._tier_preference": "data_content",
      "index.uuid": "5rD8pbovTa6RLi4dO2kw8Q",
      "index.version.created": "9009000"
    }
  },
  "artha_job_content_vectors_au": {
    "settings": {
      "index.creation_date": "1785855857310",
      "index.number_of_replicas": "1",
      "index.number_of_shards": "1",
      "index.provided_name": "artha_job_content_vectors_au",
      "index.routing.allocation.include._tier_preference": "data_content",
      "index.uuid": "kki_Wl_pRPmxorf5bboIZg",
      "index.version.created": "9009000"
    }
  },
  "artha_archived_jobs": {
    "settings": {
      "index.creation_date": "1784620154949",
      "index.number_of_replicas": "1",
      "index.number_of_shards": "1",
      "index.provided_name": "artha_archived_jobs",
      "index.refresh_interval": "60s",
      "index.routing.allocation.include._tier_preference": "data_content",
      "index.translog.durability": "request",
      "index.uuid": "XF3RJK01QQmkJKEL2qocoQ",
      "index.version.created": "9009000"
    }
  },
  "artha_job_content_vectors_uk": {
    "settings": {
      "index.creation_date": "1785853260664",
      "index.number_of_replicas": "1",
      "index.number_of_shards": "1",
      "index.provided_name": "artha_job_content_vectors_uk",
      "index.routing.allocation.include._tier_preference": "data_content",
      "index.uuid": "J2cOU5bWQB6NZALpy1RC_w",
      "index.version.created": "9009000"
    }
  },
  "artha_job_content_vectors_v2": {
    "settings": {
      "index.creation_date": "1785391216036",
      "index.number_of_replicas": "1",
      "index.number_of_shards": "3",
      "index.provided_name": "artha_job_content_vectors_v2",
      "index.refresh_interval": "1s",
      "index.routing.allocation.include._tier_preference": "data_content",
      "index.uuid": "fNVyOWMKTg-Bp4sNwNn4Vg",
      "index.version.created": "9009000"
    }
  },
  "artha_job_content_vectors_v3": {
    "settings": {
      "index.creation_date": "1785412914243",
      "index.number_of_replicas": "0",
      "index.number_of_shards": "3",
      "index.provided_name": "artha_job_content_vectors_v3",
      "index.refresh_interval": "60s",
      "index.routing.allocation.include._tier_preference": "data_content",
      "index.uuid": "OSN32zR0T4KmtZ-J8by8XQ",
      "index.version.created": "9009000"
    }
  },
  "artha_job_content_vectors_gb": {
    "settings": {
      "index.creation_date": "1785843483982",
      "index.number_of_replicas": "1",
      "index.number_of_shards": "1",
      "index.provided_name": "artha_job_content_vectors_gb",
      "index.routing.allocation.include._tier_preference": "data_content",
      "index.uuid": "Ib1tbxh0RJ6hJUsnVXWN7g",
      "index.version.created": "9009000"
    }
  },
  "artha_job_content_vectors_de": {
    "settings": {
      "index.creation_date": "1785853278933",
      "index.number_of_replicas": "1",
      "index.number_of_shards": "1",
      "index.provided_name": "artha_job_content_vectors_de",
      "index.routing.allocation.include._tier_preference": "data_content",
      "index.uuid": "ISKYfN6JQpii4hpfCtuDTg",
      "index.version.created": "9009000"
    }
  },
  "artha_job_content_vectors_us": {
    "settings": {
      "index.creation_date": "1785838823164",
      "index.number_of_replicas": "1",
      "index.number_of_shards": "2",
      "index.provided_name": "artha_job_content_vectors_us",
      "index.refresh_interval": "60s",
      "index.routing.allocation.include._tier_preference": "data_content",
      "index.uuid": "rg1snS3OQgKVWBIQ80n49Q",
      "index.version.created": "9009000"
    }
  },
  "artha_job_content_vectors_ca": {
    "settings": {
      "index.creation_date": "1785843484434",
      "index.number_of_replicas": "1",
      "index.number_of_shards": "1",
      "index.provided_name": "artha_job_content_vectors_ca",
      "index.routing.allocation.include._tier_preference": "data_content",
      "index.uuid": "owwvANg4TUi2NPnu-5__pA",
      "index.version.created": "9009000"
    }
  },
  "artha_job_content_vectors_ae": {
    "settings": {
      "index.creation_date": "1785870613061",
      "index.number_of_replicas": "1",
      "index.number_of_shards": "1",
      "index.provided_name": "artha_job_content_vectors_ae",
      "index.routing.allocation.include._tier_preference": "data_content",
      "index.uuid": "40s5m0XMTaiEMD3wgOriTQ",
      "index.version.created": "9009000"
    }
  },
  "artha_job_content_vectors_in": {
    "settings": {
      "index.creation_date": "1785837667292",
      "index.number_of_replicas": "1",
      "index.number_of_shards": "1",
      "index.provided_name": "artha_job_content_vectors_in",
      "index.refresh_interval": "60s",
      "index.routing.allocation.include._tier_preference": "data_content",
      "index.uuid": "5R7or5CcRqK6F1QFekdg_w",
      "index.version.created": "9009000"
    }
  }
}

as well as the current segment information from:

GET /_cat/segments/artha_*?v

Total 853 Segments
  1. Our Use Case

The main index is:

artha_jobs

Each Elasticsearch document represents one job.

A job document contains information such as:

  • Job title

  • Company

  • Salary

  • Location

  • Job description

  • Other job-related fields

Our backend uses this index to search and return jobs to our frontend.

Job Lifecycle

Jobs have an expiration period. Once a job expires, it should no longer be available in the active search results.

Our current flow is:

New Job
   ↓
artha_jobs
   ↓
Job expires
   ↓
Move to artha_archived_jobs
   ↓
Delete from artha_jobs
   ↓
Keep archived for some time
   ↓
Eventually delete from artha_archived_jobs

The ingestion/processing application runs multiple times throughout the day and can ingest around 6–7 million documents per day.

The same application also identifies expired jobs, moves them to the archive index, and deletes them from the active index.

So the workload consists of:

High indexing + updates + deletes + continuous search traffic

7. Segment Merge Issue

This is where we are currently facing the problem.

During periods of heavy indexing, updating, and deleting, we see a significant increase in Lucene segment activity.

During these periods:

  • Disk IOPS increases significantly.

  • CPU usage can reach around 100%.

  • Segment merging continues for a considerable amount of time.

  • Search performance degrades significantly.

Our normal search latency is around:

200–300 ms

During heavy segment merging:

3–4 seconds

Once the merge activity settles down, search performance comes back closer to the normal 200–300 ms range.

Our understanding is that the high volume of indexing, updates, and especially deletes is generating substantial segment/merge activity.

We cannot simply remove deletes from the workflow because expired jobs must be removed from artha_jobs and should not appear in production search results.

We have therefore not changed the merge settings yet because we wanted to understand the underlying issue and get recommendations before tuning Lucene/Elasticsearch settings.

We would especially appreciate guidance on:

  1. Whether our current VM/storage configuration is appropriate for this workload.

  2. Whether our index/shard architecture should be changed.

  3. Whether there are recommended approaches for handling this level of indexing + updates + deletes.

  4. Whether we should consider index rollover/time-based indices or another architecture.

  5. Which metrics you would recommend monitoring to confirm the merge pressure.

  6. Whether we should consider merge-policy tuning, or leave the defaults and address the architecture/hardware first.

The current merging output is also attached for reference.

We are primarily looking for advice on the right architectural approach before making merge-policy changes.

Can I thank for excellently written detailed problem description.

The only thing I don't really get is where the updates are coming from? But looking at:

you can see even with almost 6x as many docs, the store_size of artha_archived_jobs and artha_jobs are almost the same. docs.deleted might be interesting :slight_smile:

I also note in the later screenshot artha_jobs's store.size has already jumped to 111GB+.

@stephenb and others will likely weigh in, but from my side I see:

I wasn't expecting 2. I was expecting .. well, many more.

3000 IOPS still seems a lot if you are as old as me, but in 2026 I think this is way short. I don't know Azure costs or your budget, but I'd be looking to increase this substantially.

Those are the 2 things I would be changing first. I would expect more IOPS and more CPU to decrease the "slow" periods substantially.

Devil is in details, but a time filter would seem to be able to exclude hits based on this "expiration period"? And also If this expiration period is always known, i.e. every job always, throughout its lifecycle, has a known and unchanging expiry date, then the indexing could use this and you can partition the data based on it, maybe searching an alias instead? That could potentially turn the eventual cleanup from millions of individual document deletes into deleting whole indices, which is a better fit performance wise.

btw, are the artha_job_content_vectors_* updated/deleted at the same time as artha_jobs ? If so, then same problems with artha_jobs will apply here too, and ... you'll need CPU and IOPS to handle it.

Thanks @Dhruv_Mavani for the details.

I agree with @RainTown.

TL;DR: You need more CPU and IOPS.

Simply put, you need more CPU and IOPS—especially for a workload like yours—before you start trying to tune low-level settings like merge settings. Elastic’s OOTB settings are very good. If you slow down or make segment merging less aggressive, you will fall behind on the merging process, which will cause queries to run slower and hold CPU longer.

I work across the major CSPs on various workloads and we have many customers on Azure (and I like Azure a lot), but their low IOPS for SSD and (limited NVMe options ) often show up with symptoms exactly like you are seeing.

IOPS is likely the more important factor here, which can be difficult to scale on Azure. I had one customer that appeared completely CPU bound; segment and force merges were taking forever on FSv2 High CPU. We moved them to Lsv3 NVMe with less CPU and the whole system ran faster because it provided roughly 10x the IOPS. I don't think you are really there yet, but that was a real eye opener.

Recommendations:

  1. Scale Resources: Without getting too deep into the analysis, double the CPU and IOPS and see what results you get.
  2. JVM Heap: Set the Elastic JVM heap to 50% of the host OS (or leave it unset and it will figure it out).
  3. Upgrade: Move to version 9.4.5. Version 9.0.x is already outdated and 9.4.5 includes significant improvements.
  4. Index Tuning: As @RainTown pointed out, some index-level tuning could likely be done.

Hope that helps.

@RainTown @stephenb Thanks for the detailed feedback.

The question about where the updates are coming from is absolutely valid.

A bit more context on our workflow:

Where the updates come from

We have an application called Enrichment that continuously processes jobs in artha_jobs.

The original job document (only some of document not all) may not contain all the information we need, so the Enrichment application updates existing documents by adding/refreshing fields such as:

  • Job title

  • Company information

  • Logo URL

  • Other enriched job metadata

So our workload is not only new document ingestion. We have a combination of:

6–7M new documents/day + frequent updates + frequent deletes

Why artha_jobs and artha_archived_jobs have similar sizes

You are correct that the document counts look unusual:

  • artha_jobs → ~7.7M documents / ~100 GB

  • artha_archived_jobs → ~41M documents / ~97 GB

The reason is that when we move an expired job from artha_jobs to artha_archived_jobs, we don't copy the complete original document.

artha_archived_jobs contains only the fields required for our temporary archived-job use case, so the archived document is significantly smaller than the original document.

We keep these archived documents only temporarily because users can still have old job links shared on social media or other platforms. We need the old job page to remain available for some time, even though the job should no longer appear in the active job search.

After that retention period, the archived document is deleted as well.

What we are actually observing

The important point is that our cluster is normally not resource constrained.

When there is no heavy Lucene merge activity:

  • CPU is generally around 2–6%

  • Search latency is around 200–300 ms

  • Disk IOPS is normal

  • The application and search API perform normally

The problem starts specifically when Lucene begins intensive segment merging.

At that point we see:

  • Multiple segments being merged into larger segments

  • Linux disk queue size increasing from roughly 0.0–0.3 to around 3–4+

  • Disk IOPS increasing significantly

  • CPU jumping toward 100%

  • Search latency increasing from 200–300 ms to 3–4 seconds

  • In some cases, search requests time out and the platform becomes very slow or temporarily unavailable

We also have resource-utilization screenshots for both situations:

  1. Normal operation with no heavy merge activity

  2. During heavy segment merging

The contrast is quite significant.

We already tried adding more nodes

We also tested increasing the cluster from 3 nodes to 5 nodes.

However, that did not really solve the underlying problem.

During normal operation, the cluster is already using only around 5–10% of available resources, so adding more nodes leaves a lot of capacity unused most of the time.

When the large merge starts, the available resources are consumed very aggressively anyway.

So our concern is not simply that the cluster does not have enough total resources. The problem appears to be that a merge operation can temporarily consume the available CPU and storage I/O capacity and directly impact search traffic.

Regarding the suggestion of using time-based indices

This is something we can investigate.

However, our main concern is that we cannot stop updates or deletes, because they are part of the core business workflow.

We need to:

  • Add new jobs continuously

  • Enrich/update existing jobs

  • Remove expired jobs from the active index

  • Move expired jobs to the archive index

  • Eventually delete archived jobs

So we are mainly trying to understand whether there is a recommended Elasticsearch architecture, index design, or configuration for this type of workload where high-frequency indexing + updates + deletes must coexist with low-latency search.

For example, we would be very interested to know whether there are Elasticsearch features or recommended patterns for this scenario that can reduce the impact of segment merging, rather than simply adding more nodes.:pleading_face:

Hi @Dhruv_Mavani thanks for the details

Yes! Elastic can do this, does this all the time and it can do it a MUCH higher volumes of writes, searches and merges.

For you, The answer is maybe / maybe not on your current HW profile.

HW matters IOPs is THE key for your type of Use Case along with sufficient CPU

You are likely 10x too low on the IOPs <<<

Local NVMe IOPs is typically measure in the 100s of Thousands up to Millions of IOps
Even the lsv3 (local NVMe) is 400K IOPs for the smallest Node. (which is big)
Horizontal scaling on this profile is not probably no going to help much
You are running on tiny IOPs choked HW (sorry).

That is node exported dashboard right?

Can you share the Disk I/O Utilization chart during heavy merge

Share that chart

Also there are some other strange things like why is network so high during the merges, I would need to think about that.

If you want to see something different, and assuming you can test with representative loads.

  1. vertically scale the nodes because if I recall on Azure you will get more IOPs as you vertically scale you will see a difference I suspect. Example double it to 4vCPU and enough disk to double the IOPs I think you will see a difference, it may not completely solved but I think you will see a difference.
  2. if you really want to see nvme, setup and LSV3 put all 3 nodes on it to test and see the difference. Unfortunately local NVME is limited on Azure (perhaps there are some other high performance disk ... but we see this issue all the time)
  3. Get your boss to let you try AWS i4 or c8gd and you will see staggering different performance profiles.

Yep.

Yes, absolutely it can, so you need size your resources to meet your requirements. And you want the merge operation to NOT impact searches, at least not for long, so you want that merge operation to complete ASAP.

Well, outside that adding more nodes is not really the suggestion, you sort of need to get over the idea that resources being mostly idle is somehow evidence that you have enough capacity. It's not, and you don't.

A washing machine is using relatively little power for most of a washing cycle, yet at certain points it spins like mad, or when the heater kicks in, it uses 10x that power. Is that broken? No, those few minutes of high power consumption are an essential part of what the washing machine is there to do. The high power mode is available all the time, but only used in bursts.

Your current workload, as described, is similar, due to the way elasticsearch/lucene works. There are going to be periods where merges need to “spin like mad”. So you need give it enough oomph to be able to do so, and do so swiftly. As of now you are simply restricting it, and you are noticing it (via your slow searches).

Theoretically, someone could write a patch to elasticsearch - every time a merge operation wants to start, some API/code/tool is called that adds a bunch more CPU/IO resources, and when the merge operation is complete, the resources are returned/released. TurboSegmentMergeMode. I volunteer to test when ready, but sadly will have to leave the implementation details to the developers :grin:

Until then, you will need to allocate enough resources to the cluster to handle the peaks, not just the "normal" periods.

Hi @Dhruv_Mavani

Hope we have not lost you.

You are clearly a competent detailed engineer, and I apologize if it seems like we are piling on but we really want to help solve your issue.

I have spent some time thinking about this and wanted to take the time to explain.

Here are my concrete suggestions ... and the whys...

If this is an important use case, move to NVMe. It may cost a few more dollars in hardware, but you stop spending time troubleshooting I/O, your users get a responsive cluster, and that keeps leadership happy.

For this type of read/write-heavy workload we always recommend local NVMe. It's just unfortunate that the options on Azure are limited. That's not bashing Azure — it's the current state of things, and from what I've heard they're aware and more SKUs are coming.

But first, let me explain why you're bottlenecking on merges, because I think the key point is this: you have 125 MB/s on paper and there is no scenario in which you actually reach it.

Here's what you're running today:

Current
VM Standard_E2as_v6 — 2 vCPU / 16 GiB
Data disk Premium SSD v2, 250 GB
IOPS 3,000
Throughput 125 MB/s

Worth knowing up front: 3,000 IOPS / 125 MB/s is the free baseline that every Premium SSD v2 disk gets regardless of size. Nothing here has been tuned — that's just the default you landed on.

There are three separate ceilings sitting below that 125 MB/s figure.

The VM caps you before the disk does. Standard_E2as_v6 has a max uncached disk throughput of roughly 90 MB/s. The disk is willing to do 125 MB/s; the VM size will not carry it. Worth confirming the Premium SSD v2 column for your exact size in the Easv6 documentation, but the conclusion holds — the VM, not the disk, is your first limit.

Throughput is IOPS × I/O size, and your I/O is small. This is the one that really matters. To convert 3,000 IOPS into 125 MB/s, your average I/O would need to be about 42 KB. To reach even the VM's 90 MB/s you'd need about 30 KB. Lucene merge I/O is a mix, but a large share of it lands in the 4–64 KiB range, and the small end dominates for postings and doc-values access. Run the arithmetic:

Average I/O size Effective throughput at 3,000 IOPS
4 KiB ~12 MB/s
16 KiB ~48 MB/s
32 KiB ~96 MB/s
64 KiB 125 MB/s (throughput-capped)

You are almost certainly living in the top half of that table. The IOPS cap binds long before the throughput cap is ever in play. That provisioned 125 MB/s is a ceiling you cannot touch with this workload, which is also why raising throughput on its own would not have helped.

Latency and queue depth. Premium SSD v2 is network-attached storage at roughly 0.5–1 ms per operation. Elasticsearch also sizes its merge thread pool from your core count:

indices.merge.scheduler.max_thread_count = max(1, min(4, vCPUs / 2))

At 2 vCPUs that is exactly one merge thread. One thread at ~1 ms latency can only issue on the order of 1,000 IOPS, whatever the disk is provisioned for. So you're latency-bound below your own IOPS cap. Worth confirming that default against your Elasticsearch version, but that setting has been stable a long time.

On top of all three: 16 GiB of RAM means roughly an 8 GB heap and 8 GB of page cache against 250 GB of data, so very little of what a merge reads is being served from memory.

Local NVMe addresses all three at once — no network hop (~50–100 µs instead of ~1 ms), roughly 90× the IOPS headroom so small I/O stops being the limit, and doubling the vCPU count lifts the merge thread ceiling at the same time.

If you want to confirm this before spending anything, put these two Azure Monitor metrics side by side for the data disk:

  • Data Disk IOPS Consumed Percentage
  • Data Disk Bandwidth Consumed Percentage

If IOPS sits pegged near 100% while bandwidth is only at 40–50%, that's the diagnosis in a single chart: IOPS-bound, with throughput you're paying for and can't use. Pair it with GET _nodes/stats/indices/merges and look at total_throttled_time_in_millis.

Now, what I would build.

You could buy your way out of this on your current storage — Premium SSD v2 scales to 80,000 IOPS and 1,200 MB/s, so I won't pretend that isn't an option. But note what it actually takes: you'd need to provision more IOPS and move to a larger VM size, because E2as_v6 caps out around 90 MB/s no matter what the disk can do. So it's a bigger VM plus a metered disk bill, and you still don't get local NVMe latency. By the time you've bought your way to the same place, it costs considerably more than just moving to NVMe.

There are a few variations on this, but here's what I'd do — a 3-node cluster.

2 × Data Nodes + Master NodesStandard_L4s_v4

Size Name vCPUs Memory (GiB)
Standard_L4s_v4 4 32
Size Name Temp Disks (Qty.) Temp Disk Size (GB) Random Read IOPS Seq. Read (MBps) Random Write IOPS Seq. Write (MBps)
Standard_L4s_v4 2 480 275,000 1,500 110,000 750

Side by side with what you have now:

Today Proposed
vCPU 2 4
Memory 16 GiB 32 GiB
Random read IOPS 3,000 275,000
Random write IOPS 3,000 110,000
Seq. read throughput 125 MB/s provisioned — 90 MB/s VM cap, ~12–48 MB/s realised 1,500 MB/s
Seq. write throughput as above 750 MB/s
Storage latency ~0.5–1 ms (network-attached) ~50–100 µs (local)
Merge threads 1 2
Raw capacity 250 GB 960 GB

The row that matters is the realised throughput one. The gap isn't 125 → 1,500; it's closer to 12–48 → 1,500, because the IOPS ceiling and the single merge thread mean you never get near the number on the invoice. The ~90× IOPS headroom is what finally lets you use the bandwidth.

A few configuration notes:

  • Heap at 16 GB, i.e. 50% of RAM. The other 16 GB becomes page cache — double what you have today.
  • RAID0 the two NVMe devices into a single filesystem. No parity needed, since Elasticsearch replicas are your redundancy, and it avoids uneven shard distribution across two separate data paths.
  • Both data nodes must be master-eligible (node.roles: [master, data]), otherwise the voting-only node below can't form a quorum.

1 × Voting-Only MasterStandard_F2als_v6

Size Name vCPUs Memory (GiB)
Standard_F2als_v6 2 4
  • Heap at 2 GB
  • node.roles: [master, voting_only]
  • Place it in the 3rd availability zone

On capacity and durability: local NVMe is ephemeral, so lose the node, lose the data. That's a little extra operational overhead, and it's entirely manageable.

  • Run 1 replica. That's what lets the cluster survive the loss of a data node. It also means usable capacity is roughly 750 GB of primary data — 960 GB raw per node, halved for the replica, less ~20% headroom for merges and watermarks. Still comfortably more than the 250 GB you have today, but worth sizing against your actual retention.
  • Snapshot to Azure Blob on a schedule (SLM) as part of normal operations. The local disks are your performance tier; the snapshot repository is your source of truth.
  • Don't ever stop/deallocate a data node — that wipes local NVMe and forces a full recovery from the replica.
  • I would nigrat to 9.4.5 Stack if you can

My day jobs is a Field Enegineer for Elastic :slight_smile:
I've seen this exact pattern before, and moving like-for-like to NVMe has solved it nearly every time. Here we're doubling the vCPU as well, which lifts the merge thread ceiling at the same time. I think if you build and run this, both you and your customer will be very happy with it.

Hope this helps.

(Transparency in writing, yes I used Claude to clean / format this)

Hi @stephenb

I really don't have enough words to thank you guys for the help during this investigation and troubleshooting.

I explored a lot of AI suggestions, case studies, and different approaches, but I wasn't able to find a clear strategy that explained our behavior as well as the discussion here.

So, thank you very much for taking the time to help.

Sorry for the delayed response. Before posting the next update, i wanted to confirm one theory from our side.

We found a bug in the application that writes to our Elasticsearch cluster.

Our application is ingesting around 6–7 million documents per day, and we currently have around 60–61 million documents in total.

Because we are storing jobs, our application has a boolean flag that determines whether an existing job needs additional details to be added or updated.

We discovered that this flag was always being treated as true, even when the document did not actually need an update.

Because of this, instead of checking and updating only the newly ingested 6–7 million documents, the application was effectively updating almost the entire 60–61 million documents every day.

So Elasticsearch was receiving a huge number of unnecessary updates, which we believe was generating a very large amount of Lucene segment merge activity.

Before fixing the bug

We were seeing:

  • CPU spikes close to 100%

  • Heavy segment merging

  • High disk I/O

  • Merge activity continuing for around 2–2.5 hours

  • Search performance being affected during the merge period

After fixing the bug

We have now fixed the application issue.

We are still seeing segment merges, which is expected given our workload, but the behavior is much better:

  • CPU spikes are much shorter

  • Merge activity is currently finishing in around 5–10 minutes

  • Search performance is not being impacted in the same way as before

  • We are no longer seeing the prolonged 2–2.5 hour merge periods

I am attaching screenshots showing the CPU/merge behavior before and after fixing the bug.

Before the bug was fixed:

**
After the bug was fixed:**

This is still our current theory, and we are continuing to monitor the cluster to make sure the improvement is consistent.

At this point, we are around 90% confident that the unnecessary mass updates were the main reason for the extreme merge pressure.

We will continue monitoring this for about a week and I will definitely update this thread with the results.

Thanks again to everyone who took the time to review the architecture and explain the behavior.

The discussion has been extremely helpful.