my cluster has one node,16 core cpu,64G total ram,28G jvm heap,index settings is:
{
"testshardread": {
"settings": {
"index": {
"refresh_interval": "-1",
"indexing": {
"slowlog": {
"level": "info",
"threshold": {
"index": {
"warn": "10s",
"trace": "500ms",
"debug": "2s",
"info": "5s"
}
},
"source": "1000"
}
},
"number_of_shards": "8",
"translog": {
"flush_threshold_size": "10G",
"sync_interval": "60s",
"durability": "async"
},
"provided_name": "testshardread",
"merge": {
"scheduler": {
"max_thread_count": "1"
},
"policy": {
"max_merged_segment": "1G"
}
},
"creation_date": "1587559581106",
"number_of_replicas": "0",
"uuid": "SIRX8njWRM2h-_LsMaiG3g",
"version": {
"created": "5040399"
}
}
}
}
}
and my question is why so many disk reads between 21:02 and 21:18 ,and 21:32 to21:46 。thands


Welcome!
May be Lucene segments are merged?
thans for reply. i think it's not . there has no meges operations during this times.i get the hot_threads and index stats merges.total and merges.current real time , but i didn't find it.
is there any chance that it's a disk read modify write problem?
You said in the title that you are doing bulk operations at the same time. Which means lot of segments created and segment merged probably. But that's a guess.
Do you have elastic monitor activated? That would help to understand.
I notice that you have an old version which is EOL now. You should really upgrade to 6.8 at least, better to go to 7.6.
Is your cluster exposed to internet by any chance?
Not so far and i will try.Thanks for your advice . About the version,eh, long story. Maybe we will upgrade at some time.
My cluster running on intranet now.

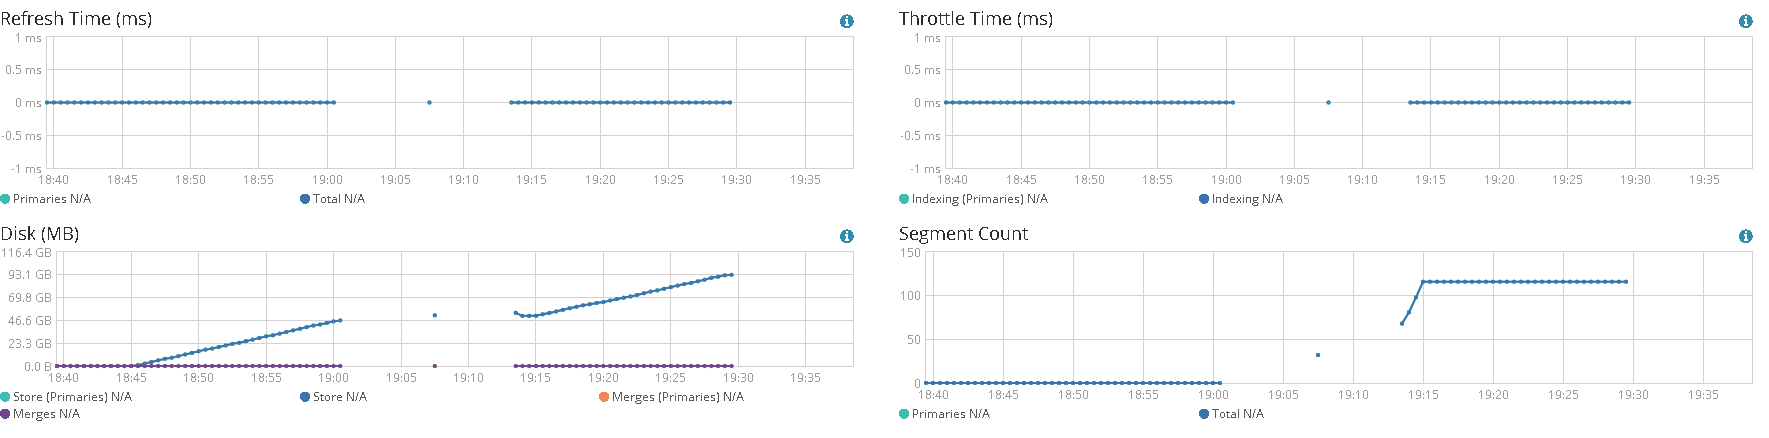


We can see that you are indexing lot of documents but at some point the total number of segments is staying at around 120 segments after a ramp up.
That clearly indicates to me that segments are merged in the background (which is expected). That implies lot of reads in addition to the writes.
Could you open one of the node in the monitoring app and show the segments. Should be something like this (7.6)

Yes.I am doing a stress test by indexing a lot of documents as soon as possible . My cluster has only on node.
here is the node segment count graph:
here is hot_treads info,( i'm sorry i cann't upload the entire log file). as you can see, there has few merge threads within 19:00 - 19:15 and 19:30 - 19:43 . These two period of time contribute the most disk reads:
[root@localhost es_monitor]# grep -E '2020-04-23-19|cpu usage by thread.*Lucene Merge Thread' hot_threads.log|grep -i -B1 merge|more
2020-04-23-19-07-36 - ::: {localhost.localdomain}{DYjsg8E8RkGXh-ceEPlFBw}{iM51ywJBTxC5ZK6h-VZ5VA}{10.45.154.78}{10.45.154.78:9300}{cname=localhost.localdomain}
48.3% (483ms out of 1s) cpu usage by thread 'elasticsearch[localhost.localdomain][[.monitoring-es-2-2020.04.23][0]: Lucene Merge Thread #60]'

2020-04-23-19-50-34 - ::: {localhost.localdomain}{DYjsg8E8RkGXh-ceEPlFBw}{iM51ywJBTxC5ZK6h-VZ5VA}{10.45.154.78}{10.45.154.78:9300}{cname=localhost.localdomain}
1.9% (19.3ms out of 1s) cpu usage by thread 'elasticsearch[localhost.localdomain][[testshardread][1]: Lucene Merge Thread #0]'
2020-04-23-19-50-44 - ::: {localhost.localdomain}{DYjsg8E8RkGXh-ceEPlFBw}{iM51ywJBTxC5ZK6h-VZ5VA}{10.45.154.78}{10.45.154.78:9300}{cname=localhost.localdomain}
10.1% (100.7ms out of 1s) cpu usage by thread 'elasticsearch[localhost.localdomain][[testshardread][1]: Lucene Merge Thread #0]'
2020-04-23-19-50-48 - ::: {localhost.localdomain}{DYjsg8E8RkGXh-ceEPlFBw}{iM51ywJBTxC5ZK6h-VZ5VA}{10.45.154.78}{10.45.154.78:9300}{cname=localhost.localdomain}
10.6% (106ms out of 1s) cpu usage by thread 'elasticsearch[localhost.localdomain][[testshardread][1]: Lucene Merge Thread #0]'
2020-04-23-19-50-50 - ::: {localhost.localdomain}{DYjsg8E8RkGXh-ceEPlFBw}{iM51ywJBTxC5ZK6h-VZ5VA}{10.45.154.78}{10.45.154.78:9300}{cname=localhost.localdomain}
8.5% (85.2ms out of 1s) cpu usage by thread 'elasticsearch[localhost.localdomain][[testshardread][1]: Lucene Merge Thread #0]'
2020-04-23-19-50-53 - ::: {localhost.localdomain}{DYjsg8E8RkGXh-ceEPlFBw}{iM51ywJBTxC5ZK6h-VZ5VA}{10.45.154.78}{10.45.154.78:9300}{cname=localhost.localdomain}
9.2% (91.9ms out of 1s) cpu usage by thread 'elasticsearch[localhost.localdomain][[testshardread][1]: Lucene Merge Thread #0]'
2020-04-23-19-50-57 - ::: {localhost.localdomain}{DYjsg8E8RkGXh-ceEPlFBw}{iM51ywJBTxC5ZK6h-VZ5VA}{10.45.154.78}{10.45.154.78:9300}{cname=localhost.localdomain}
9.4% (94.4ms out of 1s) cpu usage by thread 'elasticsearch[localhost.localdomain][[testshardread][1]: Lucene Merge Thread #0]'
2020-04-23-19-51-00 - ::: {localhost.localdomain}{DYjsg8E8RkGXh-ceEPlFBw}{iM51ywJBTxC5ZK6h-VZ5VA}{10.45.154.78}{10.45.154.78:9300}{cname=localhost.localdomain}
8.7% (86.8ms out of 1s) cpu usage by thread 'elasticsearch[localhost.localdomain][[testshardread][1]: Lucene Merge Thread #0]'
2020-04-23-19-51-02 - ::: {localhost.localdomain}{DYjsg8E8RkGXh-ceEPlFBw}{iM51ywJBTxC5ZK6h-VZ5VA}{10.45.154.78}{10.45.154.78:9300}{cname=localhost.localdomain}
3.7% (37.2ms out of 1s) cpu usage by thread 'elasticsearch[localhost.localdomain][[testshardread][1]: Lucene Merge Thread #0]'
2020-04-23-19-51-04 - ::: {localhost.localdomain}{DYjsg8E8RkGXh-ceEPlFBw}{iM51ywJBTxC5ZK6h-VZ5VA}{10.45.154.78}{10.45.154.78:9300}{cname=localhost.localdomain}
4.6% (45.5ms out of 1s) cpu usage by thread 'elasticsearch[localhost.localdomain][[testshardread][1]: Lucene Merge Thread #0]'
2020-04-23-19-51-07 - ::: {localhost.localdomain}{DYjsg8E8RkGXh-ceEPlFBw}{iM51ywJBTxC5ZK6h-VZ5VA}{10.45.154.78}{10.45.154.78:9300}{cname=localhost.localdomain}
1.2% (11.9ms out of 1s) cpu usage by thread 'elasticsearch[localhost.localdomain][[testshardread][1]: Lucene Merge Thread #0]'
I'd love to believe that too much disk reads because of merge operation,but i can not find evidence to prove it.
I have no other ideas. I don't think replication in your scenario does that. A way to eliminate this option would be to have 0 replicas and see.
@jpountz any other idea?
it already has no replicas any more. Settings are here:
{
"testshardread": {
"settings": {
"index": {
"refresh_interval": "-1",
"indexing": {
"slowlog": {
"level": "info",
"threshold": {
"index": {
"warn": "10s",
"trace": "500ms",
"debug": "2s",
"info": "5s"
}
},
"source": "1000"
}
},
"number_of_shards": "8",
"translog": {
"flush_threshold_size": "10G",
"sync_interval": "60s",
"durability": "async"
},
"provided_name": "testshardread",
"merge": {
"scheduler": {
"max_thread_count": "1"
},
"policy": {
"max_merged_segment": "1G"
}
},
"creation_date": "1587638733557",
"number_of_replicas": "0",
"uuid": "mGRhj_S5Q8StAO1rUSh4fA",
"version": {
"created": "5040399"
}
}
}
}
}
Can you share the entire content of the hot threads? Do I understand correctly that these hot threads were captured during this time when you observed a peak of reads?
yes.it's about 35M size.Shoud i send it to your email address?
35MB of hot threads with a single node? Why is it so large, have you configured very large threadpools?
No,it's not.I did a 1s sampling and output the results to a file like this:
curl -X GET "10.45.154.78:9200/_nodes/hot_threads?interval=1s&threads=5" > hot_threads.log
it's hot_threads.log file that about 35MB.
Hi,Any advice?
OK, please send it to adrien (at) elastic.co.
I'm seeing the following reads in the hot threads:
- Compound files: segments that are created by a refresh are created as a compound file (similar to a tar archive), which is implemented by first writing every file to disk as temporary files and then creating the archive from these files. These reads are usually small and from data that has just been read, so the vast majority of the time it doesn't actually go to the disk but only to the filesystem cache.
- Monitoring is periodically computing the size of files, which reads file attributes. For the record this is something that we cache more aggressively since version 6.4: https://github.com/elastic/elasticsearch/pull/30581.
- I am seeing merges in the hot threads. Merges are especially likely to trigger reads due to the fact that they read the incoming segments one time to verify checksums, and then a second time to actually merge the data.
Nice, thanks a lot. I will study the first two carefully. Any Suggestions to solving the problem?
As to the third, there has merges actually,but it is not in the serious disk reading period.In fact, it happens in the very beginning place, and the others too later. So it doesn't really matter. Am i right?
First it's not clear to me there is a problem at all. Were the hot threads you shared with me computed during the period during which you are observing lots of reads?