Elasticsearch server logs not visible in Kibana Stack monitoring

Hi,

I do collect elsticsearch server (7.10.2) logs with filebeat (7.10.2) and they do exist in filebeat-* index.
These logs do NOT appear in Kibana Stack monitoring page as illustrated in https://www.elastic.co/guide/en/kibana/7.10/user/monitoring/images/monitoring-elasticsearch.png or https://www.elastic.co/guide/en/kibana/7.10/user/monitoring/images/monitoring-elasticsearch-logs.png, What is the condition that should be satisfied so logs and log.level-counts appear in Stack monitoring application?
Here's my display with "No log data found":
Screen Shot 2021-10-26 at 15.28.48

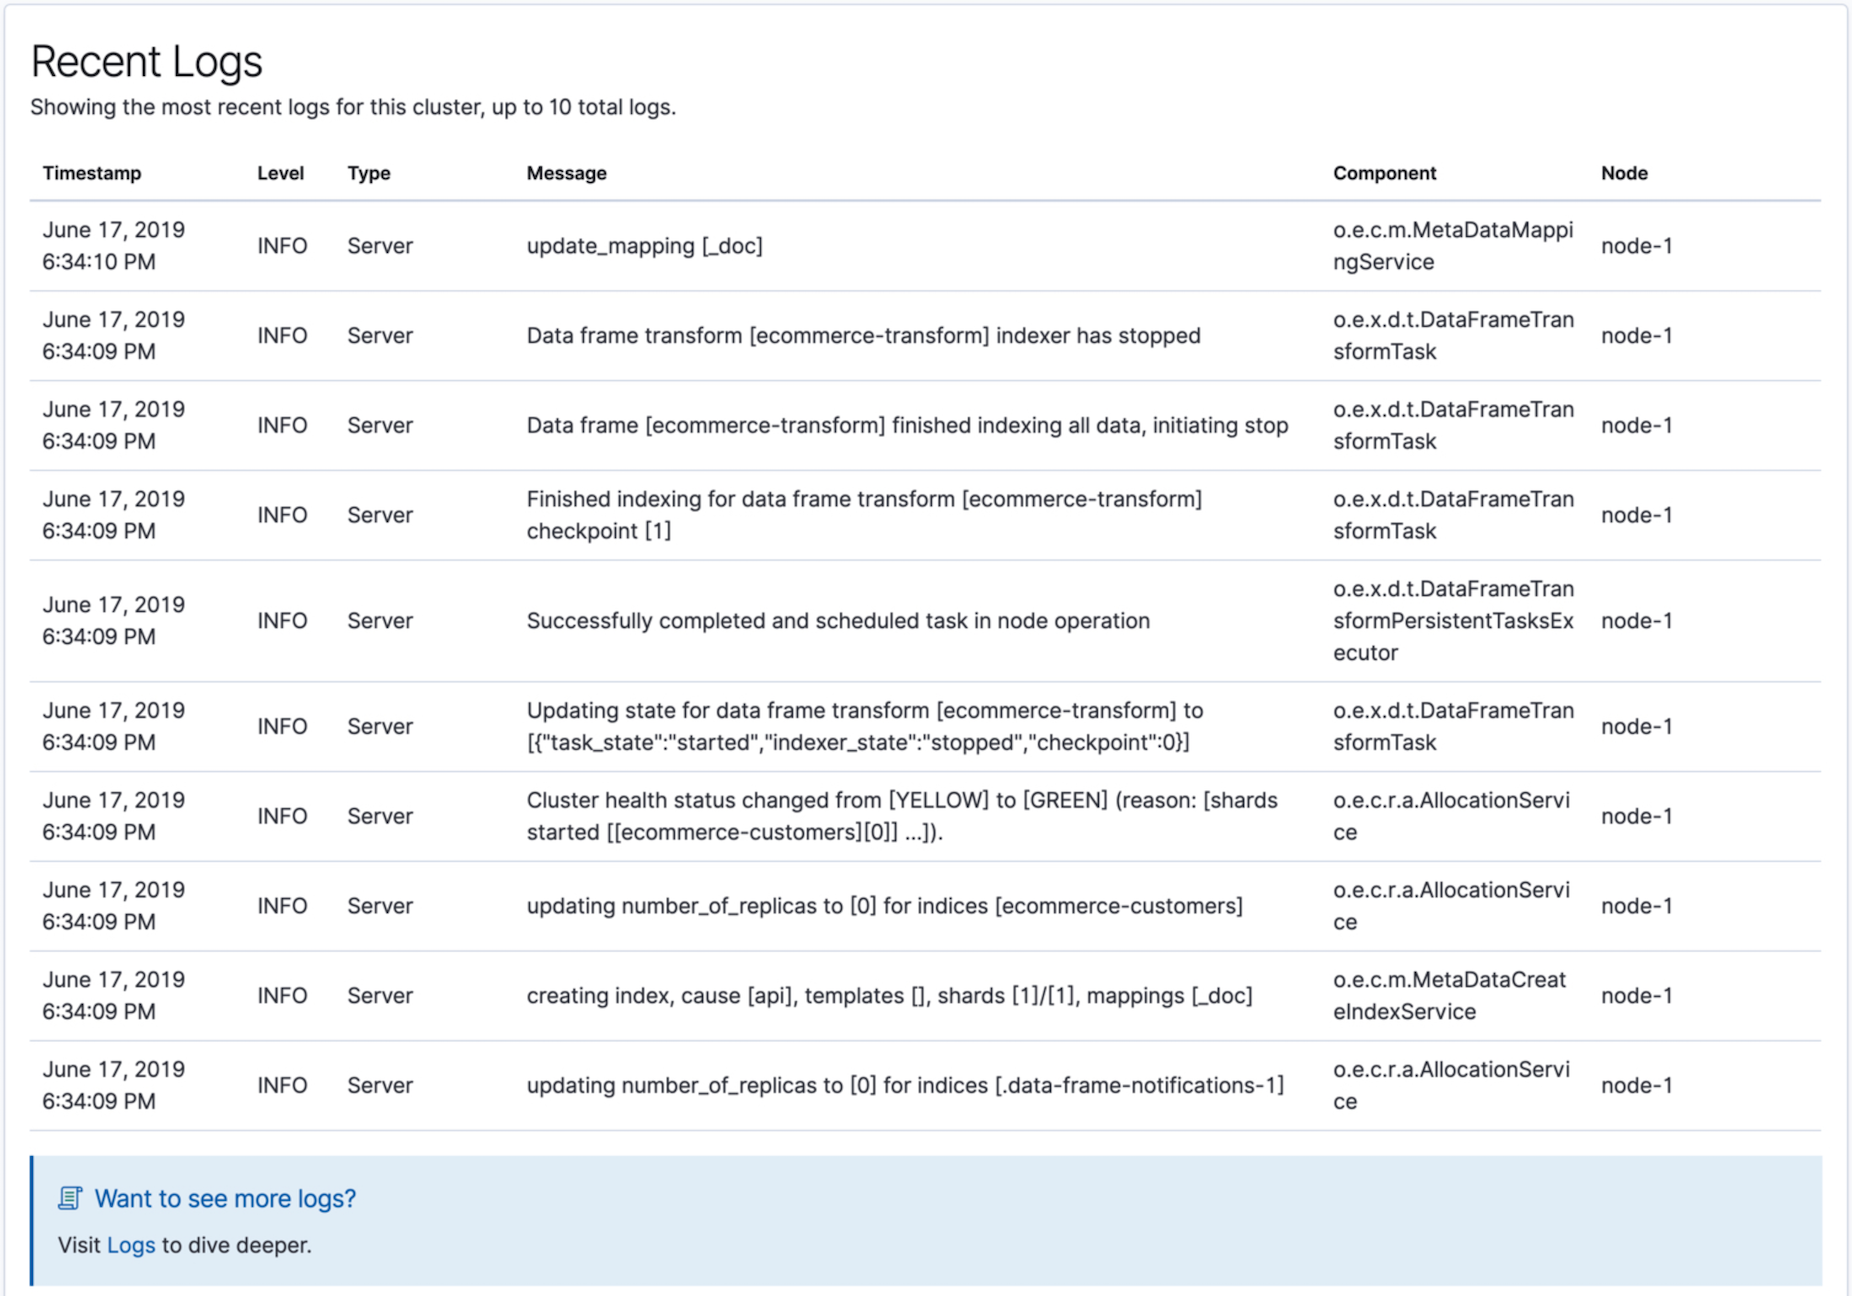
If filebeat is configured with the Elasticsearch module pointed at the cluster logs, they should show up in the filebeat-* indices on your cluster. I would double check your filebeat configuration first.

If you need to use a different index pattern you can use monitoring.ui.logs.index to override (Monitoring settings in Kibana | Kibana Guide [7.10] | Elastic).

You can see the query used to retrieve logs at kibana/get_log_types.js at v7.10.2 · elastic/kibana · GitHub - you may be able to use this to query for the data via discover or dev tools. It could be that your configuration has the logs going to an unexpected index, or even a different cluster.

Hope that helps, if not please post information about your filebeat configuration as well as what indices appear on your monitoring cluster.

1 Like

This topic was automatically closed 28 days after the last reply. New replies are no longer allowed.

Got a PM from @kalev so I re-opened this to handle any further responses.

To summarize the PM, @kalev mentioned that this query works

GET filebeat-*/_search
{
  "aggs": {
    "levels": {
              "terms": {
                "field": "log.level.keyword"
              }
    }
  },
  "query": {
    "bool": {
      "must": [
        {
          "match_all": {}
        }
      ],
      "filter": [
        {
          "range": {
            "@timestamp": {
              "gte": "2022-01-05T14:55:43.466Z",
              "lte": "2022-01-05T15:55:43.466Z",
              "format": "strict_date_optional_time"
            }
          }
        },
        {
          "match_phrase": {
            "service.type": "elasticsearch"
          }
        }
      ],
      "must_not": []
    }
  }
}

Needing to use log.level.keyword implies to me that the filebeat template isn't set up.

Load the Elasticsearch index template | Filebeat Reference [7.10] | Elastic has info on how to do that.

I've confirmed that the 7.10.2 filebeat template includes log.level as a keyword as expected.

❯ docker run --rm docker.elastic.co/beats/filebeat:7.10.2 export template | jq .mappings.properties.log.properties.level
{
  "ignore_above": 1024,
  "type": "keyword"
}

Hi,

Thnks for hints, issue was forgotten key --index-management when performing filebeat setup (thus no template was loaded).

brg,

Nice find @kalev ! Glad you got it working :orange_heart: