And my cluster can't consume more than 1.5 k events per sec from rmq.
My application produce more than 2.5k events per sec.
Almost all events are logs in json format so logstash config looks like this:
filter { json { source => "message" } }
I believe my cluster can work better. How cat I find a bottleneck? LA on severs about 0.2
Actually I think issue in Elastic configuration.
I tried to remove all filters, left only input and output and result almost the same - 1,7-1,8k events.
This does suggest your cluster is at least somewhat I/O bound. Removing replicas takes away 1/2 of the writes if you have 1 replica per primary shard. However, it seems you have a 5x speed boost. I'm with @Christian_Dahlqvist, here, in wondering how large your documents/event are.
The increase in performance due to disabling replicas is larger than I would expect. How many replicas did you have configured before? Apart from disk I/O, network usage should also drop with reduced number of replicas. What type of networking do you have in place? Is the cluster deployed on bare-metal hardware or VMs with shared networking?
What is the average size of the documents once converted to JSON (I find this a better measure than raw size as it accounts for any enrichment being performed)?
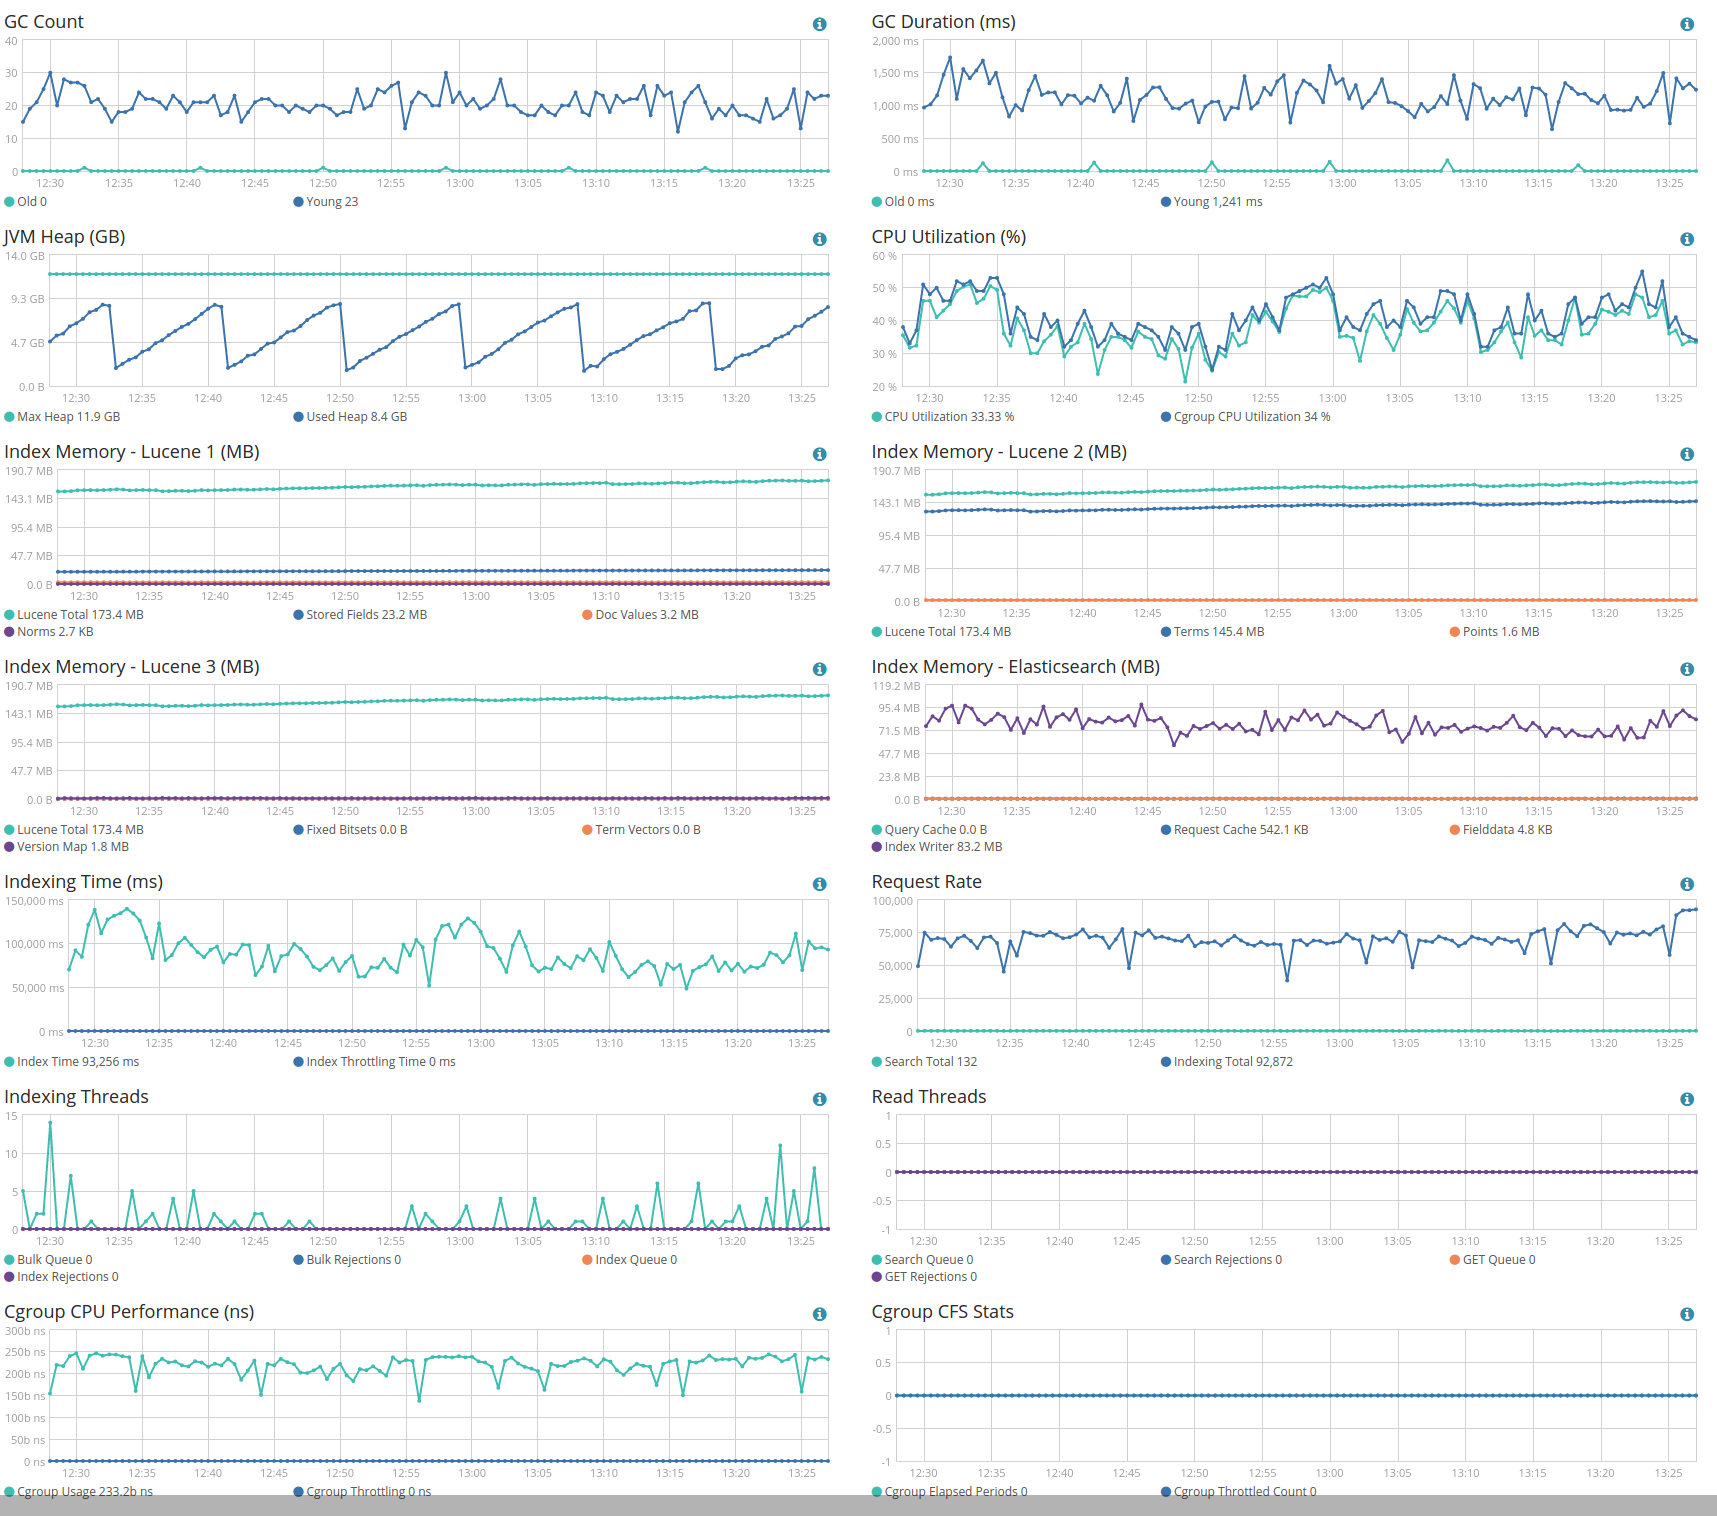
Graphs showing CPU and heap usage as well as indexing and query rates during indexing would be useful. Full screenshots of the Nodes/Overview and Nodes/Advanced screens would give us a better idea.
Apache, Apache Lucene, Apache Hadoop, Hadoop, HDFS and the yellow elephant
logo are trademarks of the
Apache Software Foundation
in the United States and/or other countries.