I have created a 3 node cluster, 1 Master Node, 1 Coordinating Node and 1 Data Node.
I am using Logstash 2.4, Elasticsearch 5.2 and Kibana 5.2.
Logstash is reading data from Kafka and sending it to the ingest node. I am not doing any data processing in logstash or in the Coordinating Node.
All are Citrix VM having same configuration of :
Red Hat Linux-7
Intel(R) Xeon(R) CPU E5-2630 v3 @ 2.40GHz 6 Cores
32 GB RAM
2 TB spinning media
Logstash Config file :
input {
  kafka {
  zk_connect=>"kfk1:2181,kfk2:2181,kfk3:2181"
    white_list => "topic_name"
    group_id => "consumer_group_name"
    codec => avro {
      schema_uri => "/apps/schema/rocana3.schema"
    }
  }
}

output {
    elasticsearch {
        hosts => ["coordinating_node:9200"]
        flush_size => 50000
        index => "logstash-applogs-test3"
      user => "elastic"
      password => "changeme"
    }
}
And I am running logstash by:
LS_HEAP_SIZE=12g nohup ./logstash -f myconfig.conf -b 10000 -u 1000 -v &
Elasticsearch Data Node's elastcisearch.yml File:
 cluster.name: my-cluster-name
 node.name: data-1
 node.master: false
 node.data: true
 bootstrap.memory_lock: true
 path.data: /apps/dataES/data
 path.logs: /apps/dataES/logs
 discovery.zen.ping.unicast.hosts: ["master1"]
 thread_pool.bulk.queue_size : 2000
 network.host: hostname
 http.port: 9200

The only change that I made in my **jvm.options** file is

-Xms15g
-Xmx15g
System config changes that I did are as follows:
vm.max_map_count=262144
and in /etc/security/limits.conf I added :
elastic       soft    nofile          65536
elastic       hard    nofile          65536
elastic       soft    memlock         unlimited
elastic       hard    memlock         unlimited
elastic       soft    nproc     65536
elastic       hard    nproc     unlimited
Indexing Rate
The maximum indexing rate that I get is 4000 documents/second

Click on the image for more details
Data Node usage:
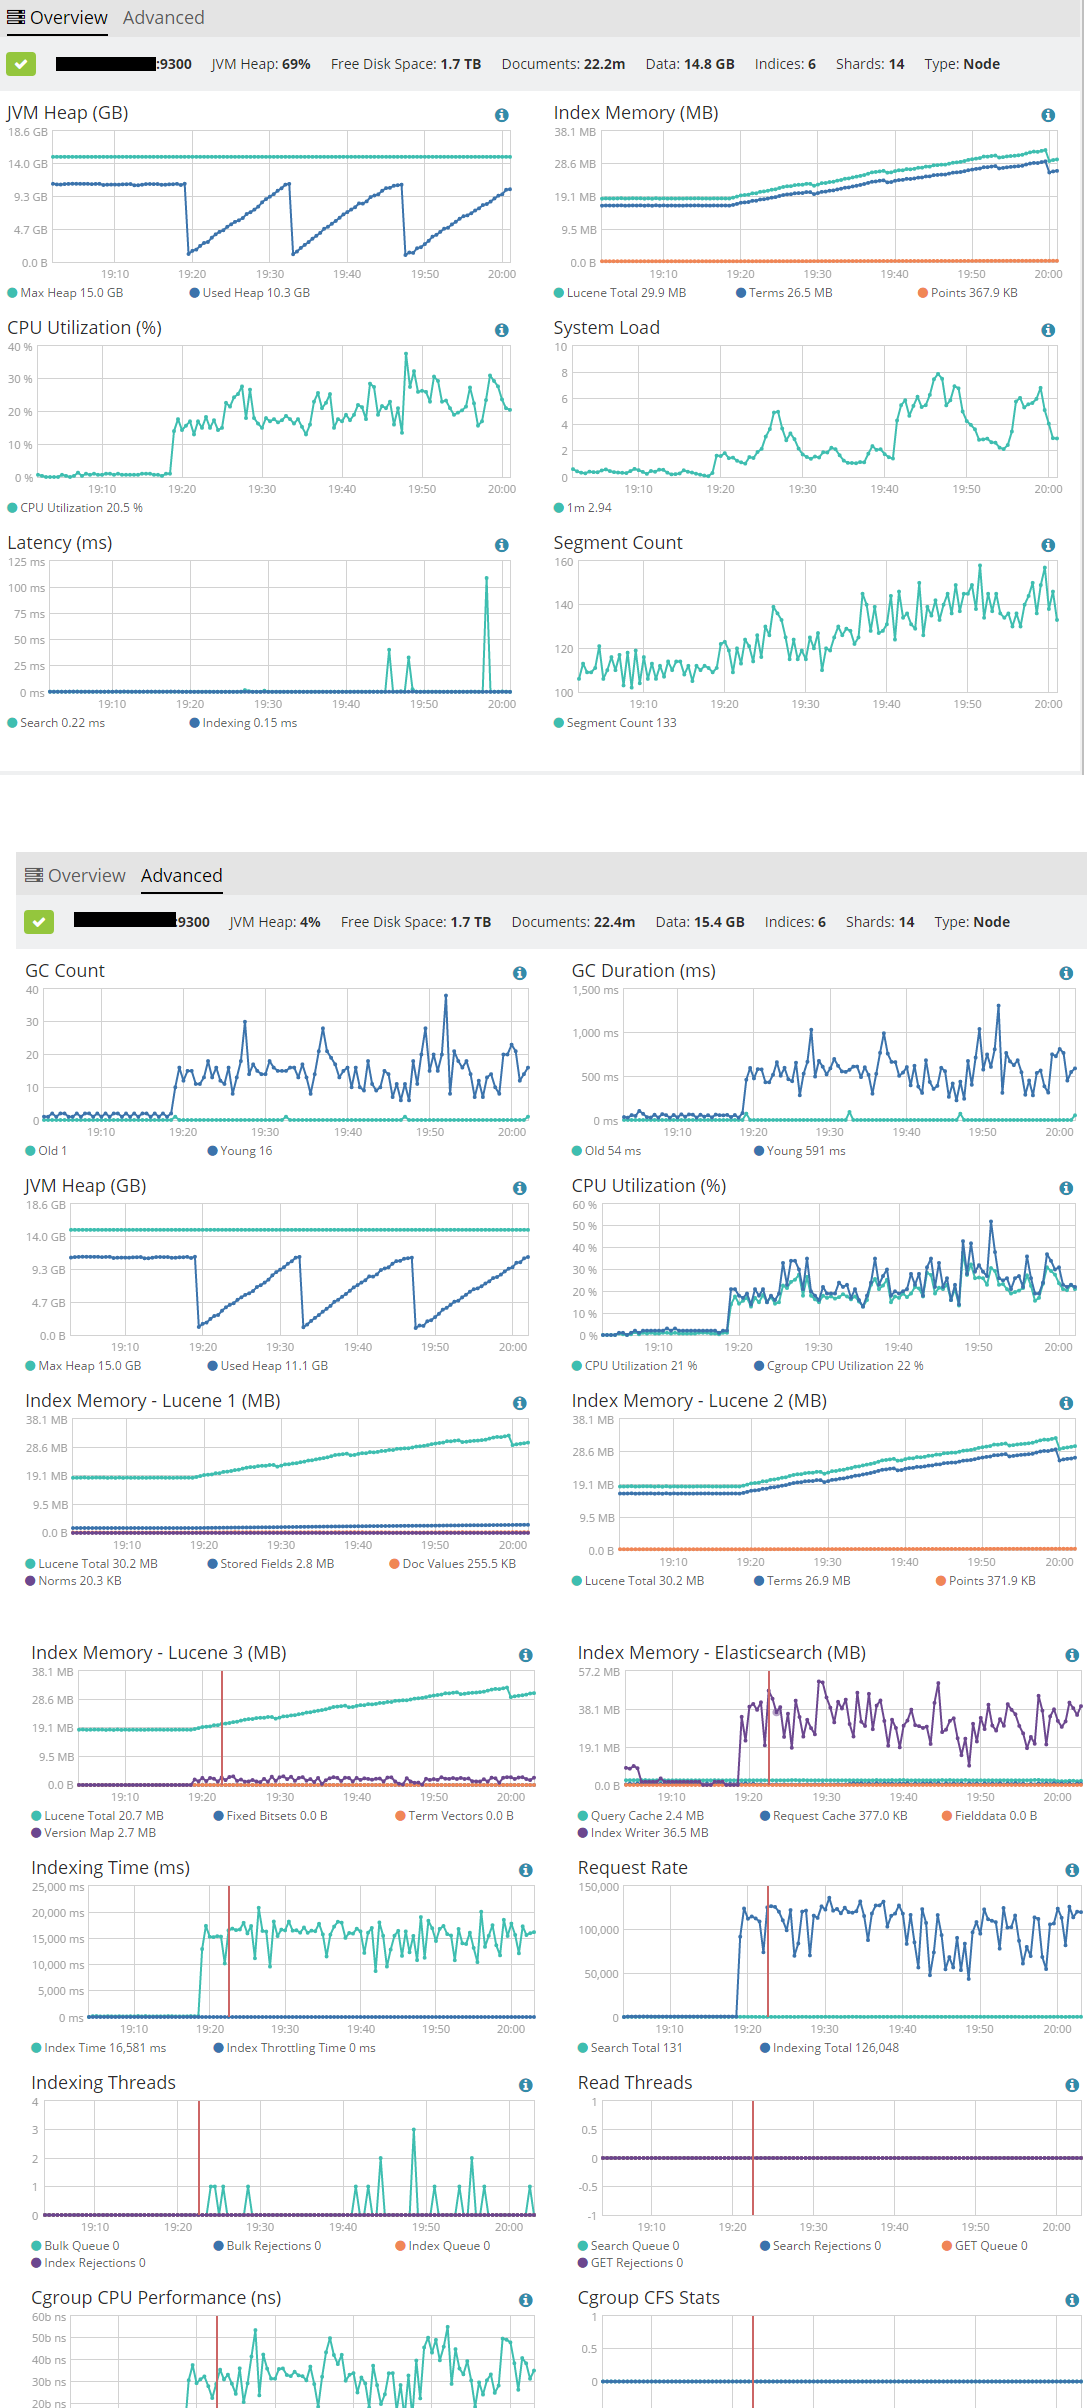
Click on the image for more details
I would like to increase the indexing rate more as I tried dumping data from Logstash to disk and got a 461MB file with 752586 events in 60 seconds. So logstash is reading around 12,500 events per second but elasticsearch is indexing around 4,000 events per second.


