Hello,
I found a problem with Endpoint agent and sleep mode.
When my computer wakes itself up from sleep mode Endpoint Agent logs:
{"file":{"line":140,"name":"Entry.cpp"}}},"message":"Entry.cpp:140 The system clock advanced more than 5 seconds in an expected 1 second window (previous time=2023-11-22T12:00:05.0Z, now=2023-11-22T13:06:11.0Z)","process":{"pid":4416,"thread":{"id":4617}}}
and every endpoint telemetries from now on will have a big discrepancy between event.ingested and event.created:
Thanks for reaching out and providing the logs and the event showing the discrepancy.
Endpoint calculates the created time by querying the OS for the system time at the event creation time. The ingested time is set when the event is ingested into Elasticsearch.
Between event creation and ingestion, Endpoint can buffer the event locally. If the host has gone to sleep, locally buffered or queued events are expected to have a large discrepancy between these two timestamps.
You can test this by observing if the issue is resolved for new events generated after the host has awakened and had time for the queues to flush.
{"file":{"line":140,"name":"Entry.cpp"}}},"message":"Entry.cpp:140 The system clock advanced more than 5 seconds in an expected 1 second window (previous time=2023-11-22T12:00:05.0Z, now=2023-11-22T13:06:11.0Z)","process":{"pid":4416,"thread":{"id":4617}}}
For further context, the log that you have observed here is Endpoint detecting that sleep mode has occurred by comparing the system time against a saved value on a periodic interval.
Hello Norrie,
thanks for your answer.
Regarding your observation:
You can test this by observing if the issue is resolved for new events generated after the host has awakened and had time for the queues to flush.
the problem is right here:
new events (after the host has awakened) continue to have a large discrepancy, to be more precise, if we define t0 (time entering sleep mode) and t1 (awakening time), all events generated after awakening (and forever until I restart machine) have an event.ingested t1+x and event.created t0 +x.
I left my computer running for several hours after waking up and the problem persists, so I don't think I can depend on the cache.
We have received your logs and are conducting an investigation.
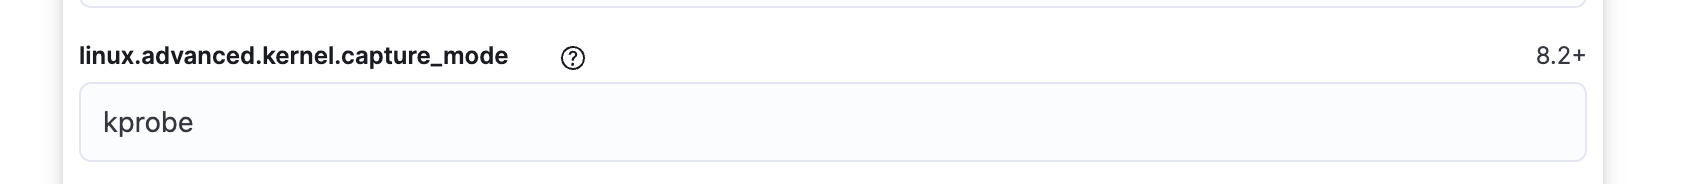
In the meantime, we think you could work around this issue by using the kprobe data capture mode. This can be found in the advanced settings of the Defend integration.
To do this wou will need to set linux.advanced.kernel.capture_mode to kprobe.
Apache, Apache Lucene, Apache Hadoop, Hadoop, HDFS and the yellow elephant
logo are trademarks of the
Apache Software Foundation
in the United States and/or other countries.