ERROR CONSULTING/MANAGING RULES - Alerts and Insights

The message error ("Unable to load rules") below appears when I try to consult or manage the rules on Stack Management > Alerts and Insights.
I've already tried to look for similar bugs here, but all of them were found on version prior than mine (which is v 8.6.1).

Can you please advise how to fix this error?
Thanks!

Hello @dudahl
Welcome to the community!!

In your environment could you please check the status of index :
.kibana_alerting_cases_*

As per the error this index must be having issues because of which the page is not loading.

Thanks!!

1 Like

Hi @dudahl

You are in a non default Space

Is that Space Granted privileges to alerts / alerts index?

You need to check the space and your role privileges

1 Like

Hi guys @stephenb @tortoise, thanks for the replies!!

I'm using the user "elastic", which is a superuser and shouldn't have any permission issues.

I think it's interesting to say that I already had 600+ rules (which are still functional) just in this space. I can check the logs tab too (screenshot below), but I can't view and manage the rules (through the tab in the first screenshot).

I also couldn't find the .kibana_alerting_cases_* index in my env.

Hello @dudahl

Please execute the below query via DevTools and share the results :

GET /_cat/shards/.kibana_alerting_cases_*?v&h=index,shard,prirep,state,store,ip,node

Thanks!!

Hey @Tortoise, sorry for the delay...
I did it and got the following result:

Ok now you are in a different space again... hard to keep track so that index is missing in that space...

@stephenb
I have rules in almost all spaces... In all these spaces, I get the error I initially reported. In any case, I repeated the command in the initial space and got the same result as before:

But... if the index had disappeared, shouldn't the rules have disappeared with it?

(in negative case) if I recreate the index, would it solve the problem without overwriting (in this case, deleting) the rules?

Hmmm I would not do that...

Please Run

GET .kibana_alerting_cases/_search. <<< I do not believe this is where alerts are stored in 8.6

GET _cat/indices/*.alerts*?v

GET _cat/aliases/*kib*?v&s=index

Also Run from Dev Tools The Kibana Alerting API

GET kbn:/api/alerting/rules/_find <<< DO YOU SEE ALERTS

GET kbn:/api/alerting/rules/_find?search_fields=name&search=test*

I would look at this before you do anything destructive

Note: I do not have an 8.6.x cluster handy to test...

Run This

I created an 8.6.1 cluster alert rules are stored in the .kibana* indices...

GET .kibana*/_search
{
  "query": {
    "term": {
      "type": {
        "value": "alert"
      }
    }
  }
}

@stephenb
It worked!! Although the result was around 7090 lines... Should I look for or do something specific with this?

#! this request accesses system indices: [.kibana_8.4.2_001, .kibana_8.6.1_001, .kibana_security_session_1, .kibana_task_manager_8.4.2_001, .kibana_task_manager_8.6.1_001], but in a future major version, direct access to system indices will be prevented by default
{
  "took": 1797,
  "timed_out": false,
  "_shards": {
    "total": 10,
    "successful": 10,
    "skipped": 5,
    "failed": 0
  },
  "hits": {
    "total": {
      "value": 1026,
      "relation": "eq"
    },
    "max_score": 2.067809,
    "hits": [
      {
        "_index": ".kibana_8.6.1_001",
        "_id": "alert:7af93a80-2506-11ef-8c2c-c931ae0c7f1e",
        "_score": 2.067809,
        "_source": {
          "alert": {
            "params": {
              "searchConfiguration": {
                "query": {
                 (...)

Thanks!!

Well I believe those are all your alerts....

So it's perhaps the alias is missing And that is why the UI cannot find it. So run this command

GET _cat/aliases/*kib*?v&s=index

And look for the alias that points to the correct kibana index

I believe there should be an alias That points to kibana_8.6.1_001

I'm sorry for my persistence, but I still don't quite understand where is the problem... I have not one but two aliases pointing to the index... What should I do with this?

many thanks for your time!!

Hello @dudahl

Could you please try to check the health for this index :

GET /cat/shards/.kibana_8.6*?v&h=index,shard,prirep,state,store,ip,node

Thanks!!

both seems to be ok:

Hello @dudahl

Since the index health is ok , next i will try to access the screen again & check the kibana logs/elasticsearch log as to why this error is received as just "Unable to load rules" will not help to find the root cause.
From the kibana/elasticsearch logs at same time we will be able to proceed forward.

Thanks!!

1 Like

@dudahl

We don't know what the problem is either, that's why we're asking you to run all these commands....

The good thing is it looks like your index and alias is there...

And so I agree with @Tortoise That you're at the point you're going to need to look at the kibana and elasticsearch logs to figure out what's going on when you access that screen.

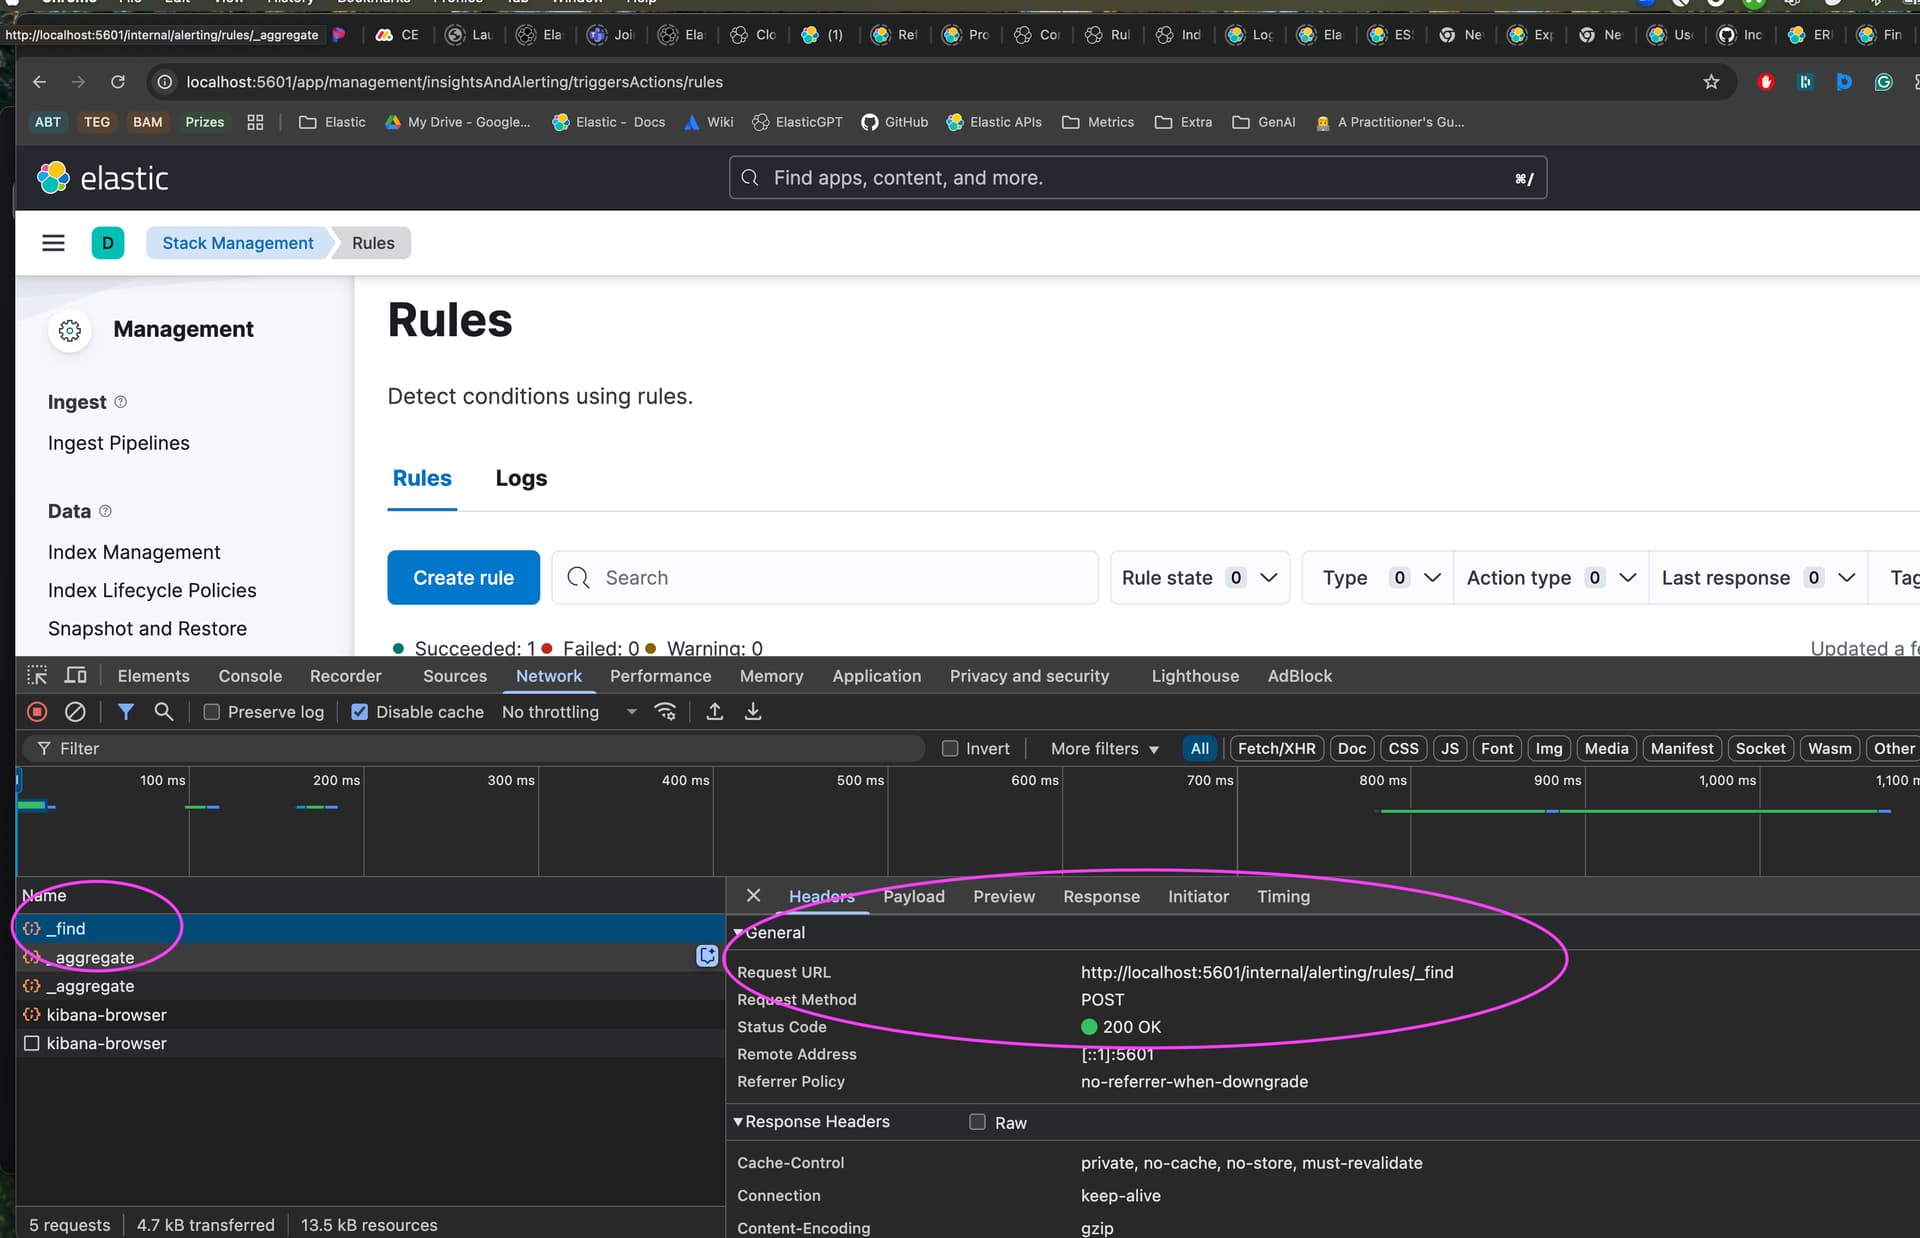
You can also go into Chrome Dev tools and see what the response is clear the network and hit refresh...

You should see the request and response

Hello @stephenb, thx for the answer!!

I did what you said and got the following result:

{
    "statusCode": 400,
    "error": "Bad Request",
    "message": "Error injecting reference into rule params for rule id 4fcb9f70-8014-11ee-b50b-0b6b99edc1f - Could not find reference for kibanaSavedObjectMeta.searchSourceJSON.index"
}

searched a little bit more and found two links that may be helpful, even though the first one was closed without resolution:

and

Interesting.... Good Finds... Any chance you can upgrade?