@willemdh there is an issue with the validation of the ML anomaly detection job configuration fields when editing one of the Logs UI jobs. It is caused by the custom_settings part of the job config containing a job_revision field which is present in the Logs UI anomaly detection jobs. I have just raised an issue in the Kibana repo for this, and will get this fixed for the upcoming 7.7.0 release.
Would you be able to confirm what version of Kibana you are running? I would not have expected to see this particular issue with the validation of the job configuration occurring prior to 7.7, so knowing your Kibana version will allow us to confirm if this is the issue you are seeing.
Sorry for the delay in replying @willemdh. As mentioned above, the issue with the job_revision field inside the custom_settings of the job should not have been present in 7.6. I have been unable to reproduce the issue on my 7.6 setup.
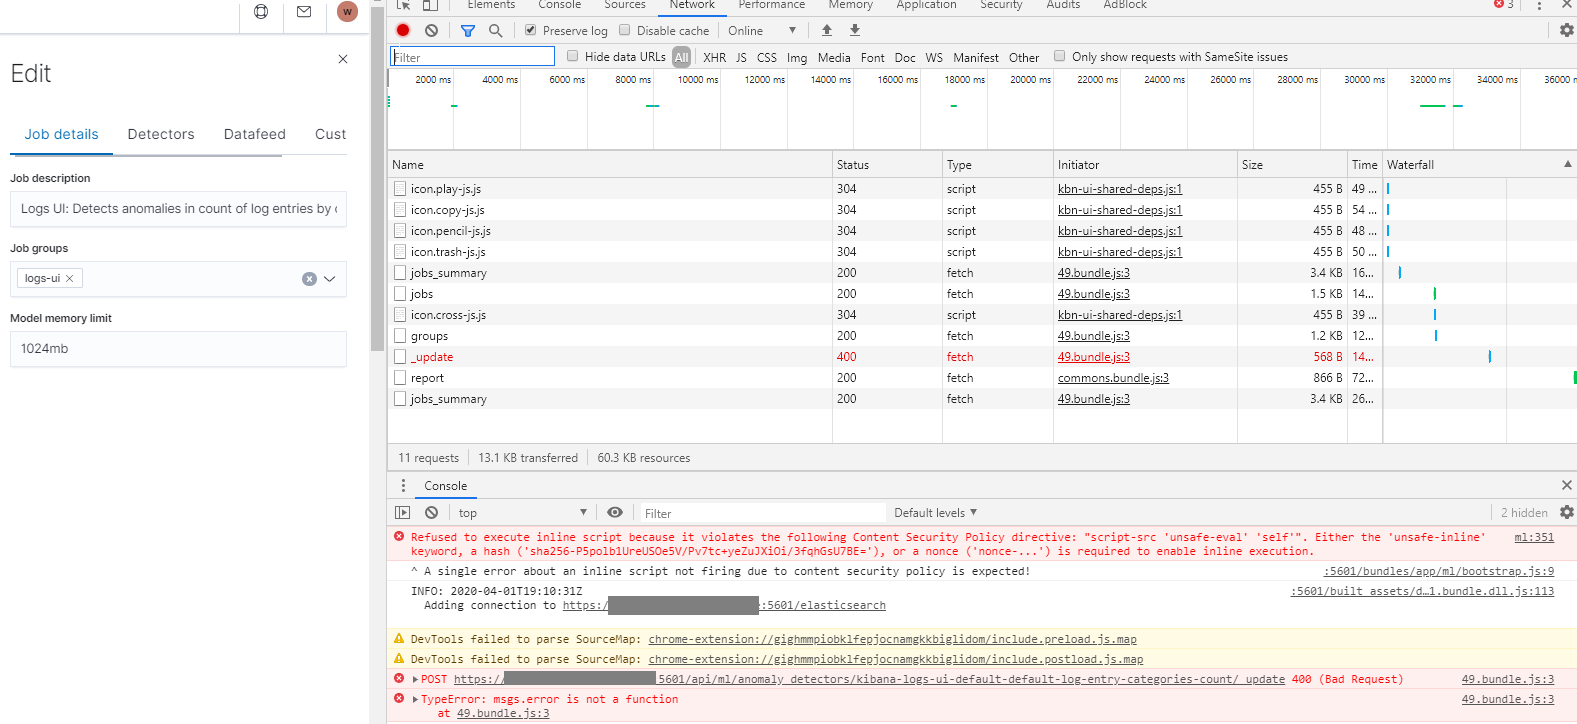
Are you able to check the Network tab in the browser's developer tools (on Chrome, select More tools - Developer tools from the menu top right), as this should show the reason behind the error shown in the screenshot above (make sure you have the network tab open before trying to edit the job and then look for a red error from one of the network requests shown in the network tab).
Thanks for the screenshot @willemdh. If you expand those last two red errors out in the first screenshot - the one for POST and the one for TypeError, does it show any more details?
Thanks for those latest screenshots @willemdh. Unfortunately those browser errors aren't giving any more insight into the exact cause of the error (note that we've improved the reporting of errors for 7.7 in this fix).
To get at the underlying error, one thing to try would be to issue the update directly via the ML API. Would you be able to run this command through Kibana's dev console, or something like curl (just double check I have the correct job ID and model memory limit here):
POST _ml/anomaly_detectors/kibana-logs-ui-default-default-log-entry-categories-count/_update
{
  "analysis_limits": {
    "model_memory_limit": "1024mb"
  }
}
One other possibility is if your elasticsearch.yml file contains an xpack.ml.max_model_memory_limit setting, an error will occur if you try to edit the job to have model_memory_limit values greater than that setting. See more details in the docs in the analysis_limits.model_memory_limit section.
@willemdh glad to hear that setting the limit to 2048mb was successful! Note that this fix for 7.7 should mean that the underlying error gets displayed in the UI.
In answer to your question, this memory comes from the system memory on the dedicated ML node running the job. It does not come from the Java heap. (This is why we recommend smaller Java heaps on dedicated ML nodes with more memory left for processes other than the JVM.)
@willemdh when a hard memory limit is hit we stop modelling new entities but not existing ones. So it's possible that the memory usage for existing ones can get bigger if, for example, we decide their distribution is multi-modal. Nevertheless, in your case it does seem like an abnormally large overrun. Please could you post the job counts (take a screenshot of the "Counts" tab after expanding the job in the jobs list). This will give us a better idea of the scenario where the overrun can be bigger than expected.
The by field count is only 3525, which is pretty low for the level of memory usage you're seeing for this job. It's possible that categorization has created far more categories than this, but anomaly detection has ignored them, hence the relatively low by field count. Would you mind running this query to find out the number of categories that have been created:
Thanks again for your help here. It will really help us work out why the memory usage has grown as it has for this logs categorization job, so we can then look to address this in a future release.
Glad I can help, thank you for the fast responses.
Imho the ml jobs kibana-logs-ui-default-default-log-entry-categories-countand kibana-logs-ui-default-default-log-entry-rate are generating much needed visibility into log rates and categories.
The kibana-logs-ui-default-default-log-entry-rate does however generate quite a bit of false positive anomalies. Or example this morning we had a planned maintenance of our Openshift Container Platform which caused huge spikes in logs for two event.datasets (ocp.log and haproxy.log). Just wondering, is there a way to 'pauze' ml temporarily for only 1 dataset in kibana-logs-ui-default-default-log-entry-rate? I know we can use the calendar functionality for ml, but that only works for the complete job afaik?
Thanks for that information @willemdh. It shows what the problem is.
When the job hit its memory limit we stopped modelling new time series for anomaly detection, but not for categorization. The number of time series being modelled for anomaly detection is 3625 (or actually slightly less as some housekeeping series are counted) but the number of distinct message categories is 14922.
I have opened https://github.com/elastic/ml-cpp/issues/1130 to get this fixed in a future version. We should have stopped creating new message categories when we exceeded the memory limit.
14922 categories is a lot, and suggests that categorization is not working well, at least for some of your types of logs (data sets). It looks like you have 14 different data sets that the job is operating on. I suspect some of these are categorizing well but others are creating too many categories to be useful. Categorization works best on logs with repeated patterns such as those generated by logging statements in a program. It doesn't work well on human generated text nor messages that consist of a sequence of field values with no descriptive parts in between. https://github.com/elastic/kibana/issues/60390 is a planned future enhancement to allow users to choose a subset of the data sets in the logs UI to send for categorization. There is another planned enhancement, https://github.com/elastic/kibana/issues/61900, to make it easier to see which data sets are not suited to categorization. Prior to this functionality being available you may be able to guess which of your data sets is generating the large number of categories and exclude it from the datafeed search of the kibana-logs-ui-default-default-log-entry-categories-count job.
Apache, Apache Lucene, Apache Hadoop, Hadoop, HDFS and the yellow elephant
logo are trademarks of the
Apache Software Foundation
in the United States and/or other countries.