I have a look at nodes status marvel told me at that time. 5 host behaved like this:
I also take a look at the gc.log and didn't find any FGC at that time, but found a lot of messages like this:
2016-01-05T22:31:09.779+0800: 10257.403: Total time for which application threads were stopped: 0.0517857 seconds, Stopping threads took: 0.0012074 seconds
Is it because of GC? But how to explain the whole indexing rate varies periodically (~ 1 minute)?
Can you share your elasticsearch.yml? Was anything changed from defaults?
I am seeing something like this in my test 2.1.1 cluster, but not as bad (short periodic) as yours. I think I know what caused mine to happen, like to see your configs first to confirm.
Hmmm, are you zoomed in to 15 minutes time range? If you put the mouse on the graph and note the time period between distinct point on the graph, is it 10s?
I believe you are running into a graphing bug. Marvel polls ES at 10s intervals.
So what you are seeing is not the same problem that I see. I can reproduce your graph by zooming in to 15 minutes time range.
I get periodic dips in my indexing rate, which I suspect is due to segments merging. The index rate will dropped dramatically periodically. Here is what I mean.
First is the 15 min window to show that I see the same graph you are. It's a bug in Marvel graphing.
The first time I saw this several weeks ago, I thought something went wrong till I zoom back out. As you can see, it show that indexing has stopped for sometime.
I've made a number of tweaks, but they are specific to my particular HW/SW environment. Let's hear more about your particular env. Beside the config you posted, any other changes? What are the specifics of your HW/SW?
The cluster I have now is purely for testing purposes. I have lots of physical ES nodes belonging to many clusters, mostly running ES 1.X. I am looking to see what is the best configs for my particular env, and migration planning for my clusters.
The whole data path is:
Logstash read data from kafka, then some grok filters and then logstash sends data to Elasticsearch.
The input and output plugin conf:
input {
kafka {
zk_connect => "host1, host2, host3"
topic_id => "prod_log"
auto_offset_reset => "smallest"
fetch_message_max_bytes => 20971520
queue_size => 500
consumer_threads => 3
}
}
Each line in log file is stored as one json message in Kafka. The average size is ~5KB。
I have 10 logstash instances and each read 3 partitions from Kafka( I have 30 partitions for my topic).
Each box has 12 SATA disks, its just JBOD, no RAID.
JVM size of ES is 31g. The bulk queue size I mean is:
"threadpool" : {
"bulk" : {
"queue_size" : "3000"
}
One thing need to mention is even I double ES boxes from 5 to 10, the indexing rate is almost same. I'm surprised there is no ES indexing performance improvements.
Thanks for posting details of your config. Are your data source generating enough data? Just wondering if there are periods where there is no(not enough) data to index, hence you get the periodic large drop in indexing rate.
You have more I/O capacity than my current test bed.
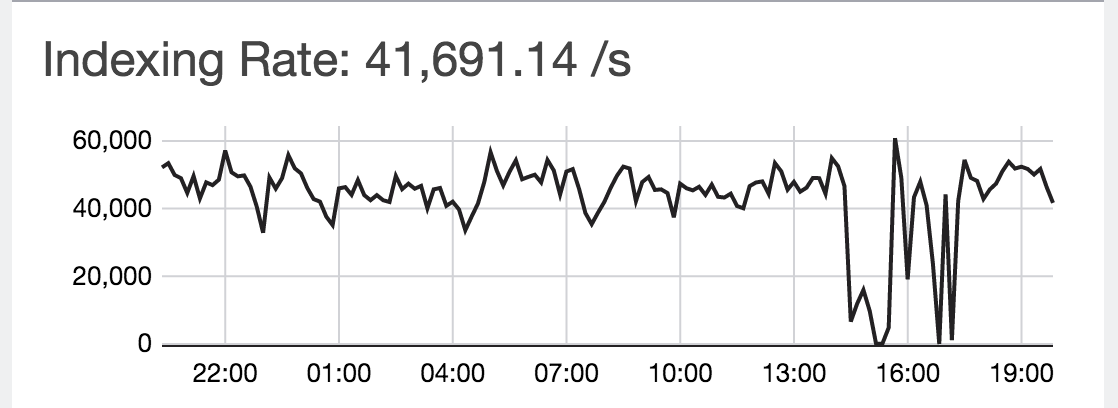
Mine is 64G RAM, 12 core HT Xeons, 2x1TB SATA set up as RAID1 and I have 31 physical boxes running ES 2.1.1. I have 33 separate (same HW config) boxes running logstash 2.1.1 using kafka console consumer, consuming 400 topics into 40 indices. I get a sustained 50K/s indexing rate. It goes between peak of 60K/s to low of 40K/s.
My bulk thread queue is on 100 though. I started with everything set to default and then tweaking one thing at a time to see the difference. This took me from before holiday break to now, about 3 weeks of work
At this point, I think I am saturating my disk I/O, but there is still some room for a little bit more in terms of indexing speed. I've managed to get up to 80K/s sustained for a few hours.
I have encountered the same problem with periodical drops of the indexing rate. When you "zoom out" you just change the interval Marvel uses to calculate the indexing rate.
I am using 2x (kafka & logstash) => 3x ES. All the machines are virtual with 4 cores and 8GB RAM. My goal is to achieve 2000-4000/s indexing rate.
Which version of kafka, logstash and Elasticsearch are you using? Because sometimes there are some errors from kafka or the zookeeper and logstash stops (especially when I use the latest version of logstash).
Could you share here the configuration you used to increase your indexing rate or at least which settings did you tweak and how did you come up with the right value?
I have noticed that if you assign 1 replica for each shard the indexing rate doubles; which means that the indexing rate in Marvel takes into account the indexing of replicas. My question here is how to achieve the same indexing rate without replicas since, as it seems, the cluster is capable of such high indexing rate?
Do I need more logstash instances for that or more output workers or more ES instances with more shards? (I don't see any big difference when I assign more output workers!)
You need to add more consumers. Are you using logstash kafka input plugin? Have you tried tweaking the number of threads? How many kafka partitions for your topic?
If possible, increase the number of partitions and have one consumer thread per partition in your consumer. You may need to add more logstash instances.
My test bed is using ES 2.2.0, LS 2.1.3 and kafka-console-consumer via the pipe input.
I am still testing and tweaking, not done yet. I intend to write up my experiences when done.
The entire ELK stack changes so fast lately it's unstable (IMHO). There are (too) many knobs to tweak
Apache, Apache Lucene, Apache Hadoop, Hadoop, HDFS and the yellow elephant
logo are trademarks of the
Apache Software Foundation
in the United States and/or other countries.