Hi, I am new to ElasticStack and trying to load dashboards into Kibana.
Kibana and Elastic Search run on same cluster and I want to monitor a remote server with metricbeat.
When I enter the command metricbeat setup --dashboards i get the following error message:
Exiting: error connecting to Kibana: fail to get the Kibana version: HTTP GET request to https://XXXX:port /api/status fails: invalid character '<' looking for beginning of va ./html>nter>nginx</center>ion Required</h1></center>d>
Any idea what I could do here?
Thanks a lot
Hi @BenKenobi,
Welcome to the community! Which versions of Elasticsearch, Kibana and metricbeat are you using? Can you check your connection settings for metricbeat and share your config?
Hi, thanks.
Version numbers:
metricbeat 7.17.12
Kibana: 8.9
Elastic: 7.17.7
# =================================== Kibana ===================================

# Starting with Beats version 6.0.0, the dashboards are loaded via the Kibana API.
# This requires a Kibana endpoint configuration.
setup.kibana:

  # Kibana Host
  # Scheme and port can be left out and will be set to the default (http and 5601)
  # In case you specify and additional path, the scheme is required: http://localhost:5601/path
  # IPv6 addresses should always be defined as: https://[2001:db8::1]:5601
  host: "https://XXX:443"

# ================================== Outputs ===================================

# Configure what output to use when sending the data collected by the beat.

# ---------------------------- Elasticsearch Output ----------------------------
output.elasticsearch:
  # Array of hosts to connect to.
  hosts: ["https://XXX:443"]

  # Protocol - either `http` (default) or `https`.
  protocol: "https"

  # Authentication credentials - either API key or username/password.
  #api_key: "id:api_key"
  username: "username"
  password: "${password}"
Is there a reason why you have different versions of Kibana, Elasticsearch and Metricbeat? Looking at the compatibility matrix you'll see that Elasticsearch and Kibana should be on the same version.
Hi Carly,
my mistake: The correct version numbers are
Kibana 7.17.7
Elastic 7.17.7
Metricbeat 7.17.12
Regards
No worries @BenKenobi. That error suggests that metricbeat cannot connect to Kibana. Can you check your Kibana settings in the metricbeat config? I assume Kibana and Elasticsearch are both up and running and are accessible?
Hi Carly,
metricbeat cannot connect to Kibana as as we have a nginx proxy/WebServer in between.
Kibana and Elasticsearch are both up and running.
My colleague told me that instead of using the command "metricbeat setup --dashboards" to load the dashboards automatically there is a way to load a dashboard manually.
Could you tell me if this is correct and if yes, where in the documentation I can find that? Thanks
Hi @BenKenobi,
As per the documentation you either load the dashboards using the setup command as you've tried or configure the dashboard loading in metricbeat.yml.
If you have an instance where you have the dashboards, you could try using the export and import APIs instead.
The other thing to consider is using the Log Monitoring and Infrastructure Monitoring apps within Kibana and see if those pre-built applications give you the views you need, especially the latter since you're capturing metrics with metricbeat.
Hi @carly.richmond
Thanks for the information regarding Dashboard Loading.
I am trying to create a new dashboard and here I am chosing index pattern metrics-* which has no fields to select from.
Normally it should not be empty, right?
I guess that I have to delete metrics-* index pattern and load it again with metricbeat setup command as recommended here Error in index or visualisations for "[Metricbeat System] Overview ECS" - Elastic Stack / Beats - Discuss the Elastic Stack?
Thanks in advance

Hi @BenKenobi,
If you have extended the time range of the query and it's still not coming through then yes I would recommend following that thread.
Let us know how you get on!
@carly.richmond I have deleted index pattern metrics-* and also template metricbeat-7.17.12 and ran metricbeat setup
metricbeat setup
and
metricbeat -e
Then I restarted metricbeat.service
Unfortunately no change.
When running command metricbeat setup I get following error message:

There is no index pattern metricbeat-* nor an index, just an index template :
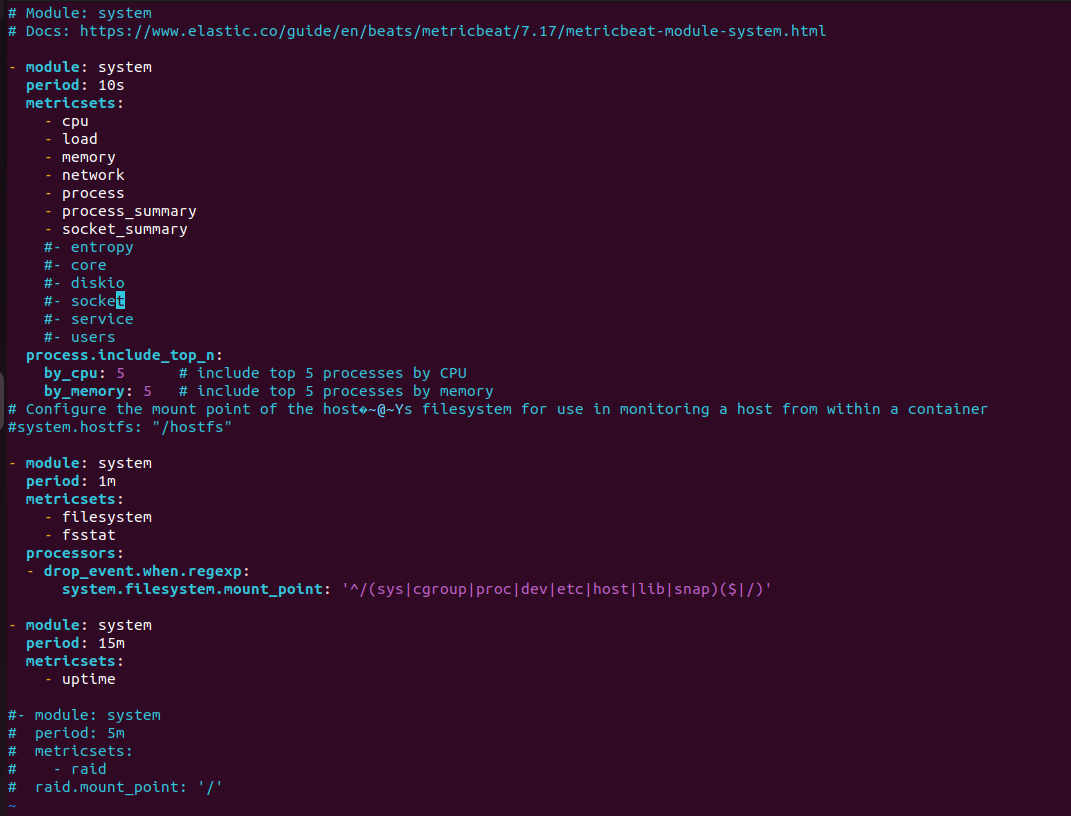
The only enabled module is system module:
output test was successful:
As far as I understood from the guide Metricbeat quick start: installation and configuration | Metricbeat Reference [8.9] | Elastic there is no need to create an index or an index pattern manually.
This is done automatically when running setup command. It should not be that difficult to load data into Kibana.
@BenKenobi yes you're right that metricbeat will create the index for you.
It's difficult to see from the error message image you provide, but I see you're getting a 403 forbidden message. It looks like Metricbeat can't connect to Elasticsearch.
Have you configured the proxy on both the Elasticsearch and Metricbeat sides? What does the config look like?