I can perform a search on index pattern with range queries on certain fields and I wanted to do visualization on the same set of fields. However these fields are not available in any kind of visualization. Any idea of what I am doing wrong ? I am using kibana/elasticsearch 5.6
Thanks! See the question mark next to the field in Discover? That means the field mapping is of an unknown type. It needs to be of number type in order for it to be available for a range aggregation. You can try refreshing your index pattern in Management > Index Patterns by clicking the refresh icon at the top right corner of that screen. If that doesn't resolve your problem you can try deleting the index and reindexing to create new mappings.
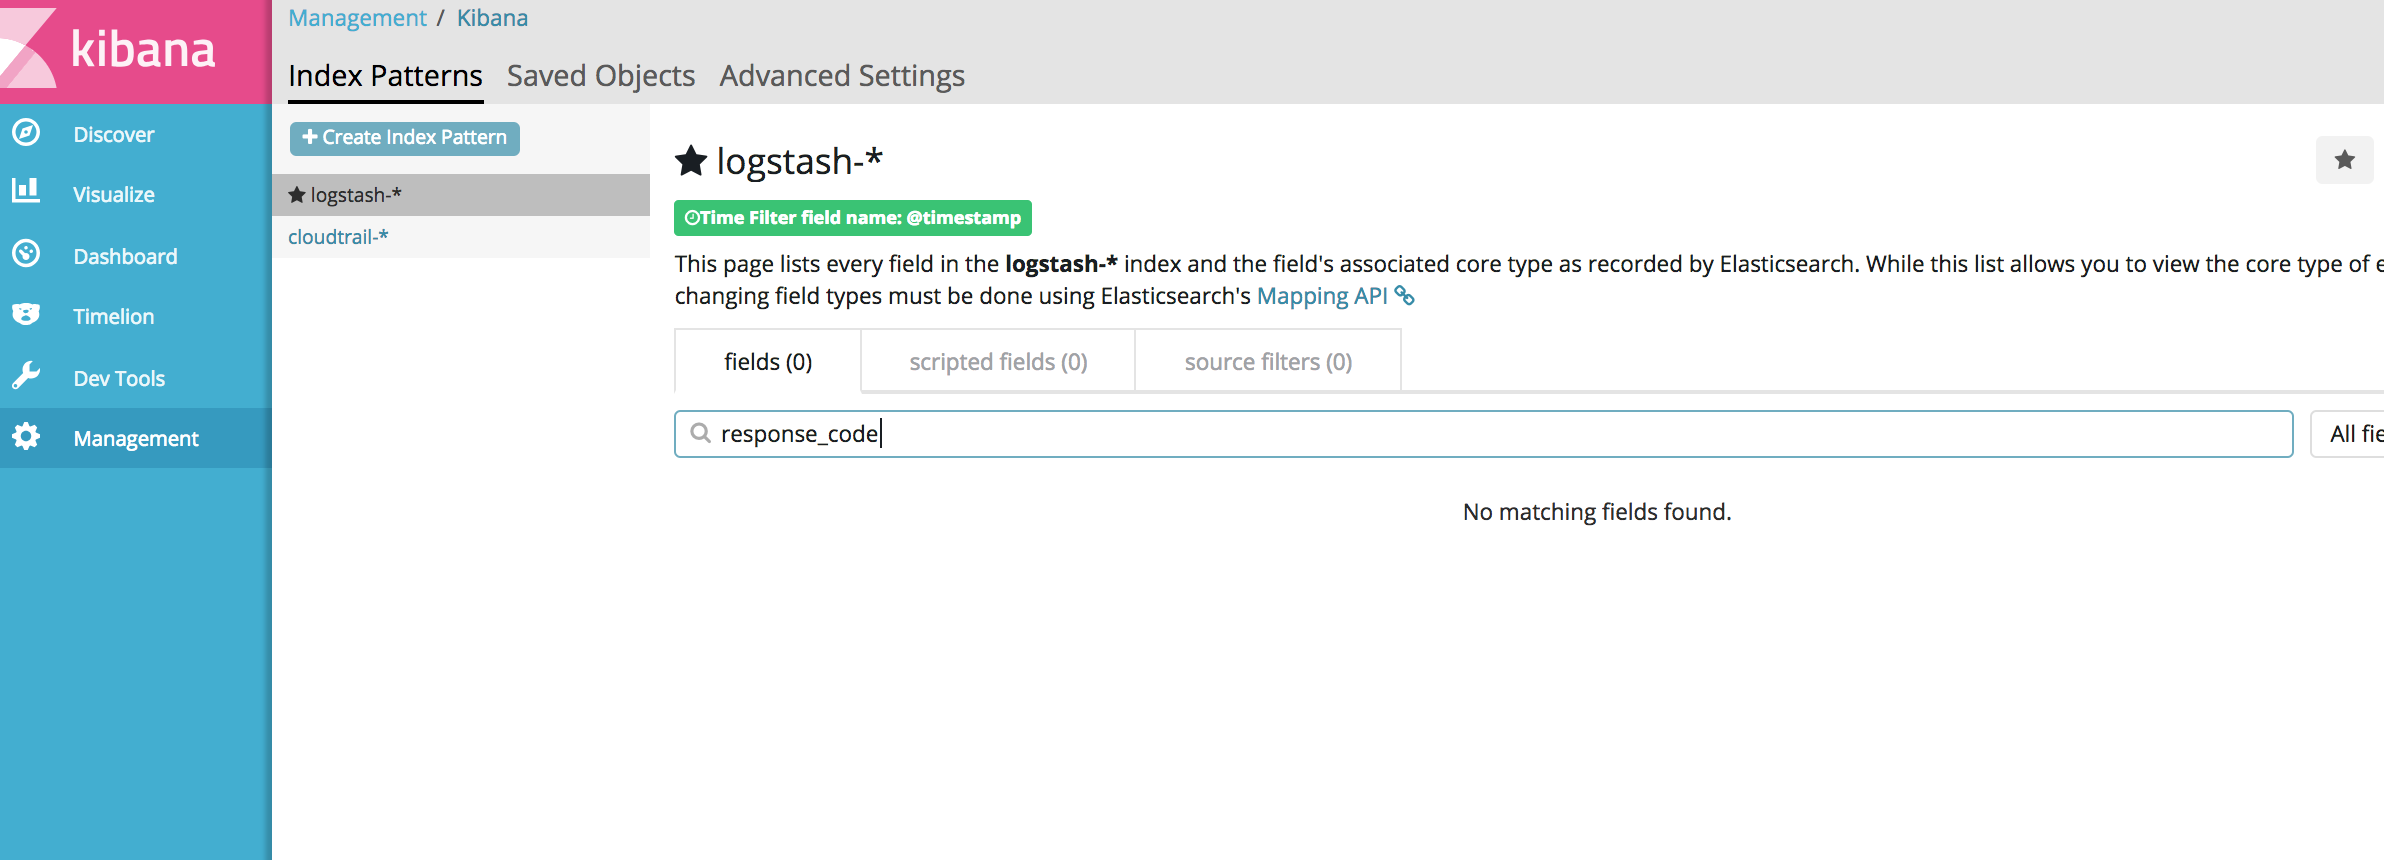
Without doing any extra mapping configuration, I split off these types of logs into own index, in the management console these fields show up with correct types.
Apache, Apache Lucene, Apache Hadoop, Hadoop, HDFS and the yellow elephant
logo are trademarks of the
Apache Software Foundation
in the United States and/or other countries.