I have a problem with Kibana. I need my Kibana to be able to bring the external IPs, it can only show internal IPs on my dashboards. A friend said that I have to log the External IP into my index for this to work, but I don't know how to proceed. My Stack is a 7.9.1 version.
If I'm understanding correctly, you want to display external IP but you're not currently storing it. I think the first step is to make sure its being logged. If its logged then its just a matter of configuring filebeat to extract it.
The IPs of customers who access the web application are being recorded in the Haproxy log. I want that Kibana to be able to include them in the application dashboard.
In Discover/Kibana the External IPs appear normally, but in the Dashboard only Internal IPs appear.
Here my Haproxy Log format:
Nov 13 12:17:37 SRV haproxy[5101]: **200.200.200.201** (**External IP Example logged in haproxy**):37926 [13/Nov/2020:13:17:36.976] http websrvs/srv1 72/0/1/228/301 200 632 - - --NI 250/250/0/1/0 0/0 "POST /sal/WS-Agends HTTP/1.1"
Here my Discover Log in Kibana (Getting External IPs from Haproxy path configured in filebeat.yml:
Nov 13, 2020 @ 12:30:43.089 @timestamp:
Nov 13, 2020 @ 12:30:43.089
message:
**177.177.177.99** ..    (**External IP Example**) - - [13/Nov/2020:09:31:30 -0300] "POST /site/test/infocall/validdata.jsp?
As you can see, the External IPs appear in the haproxy log and in the kibana's discover, but when I create a dashboard, the kibana only brings me Internal IPs.
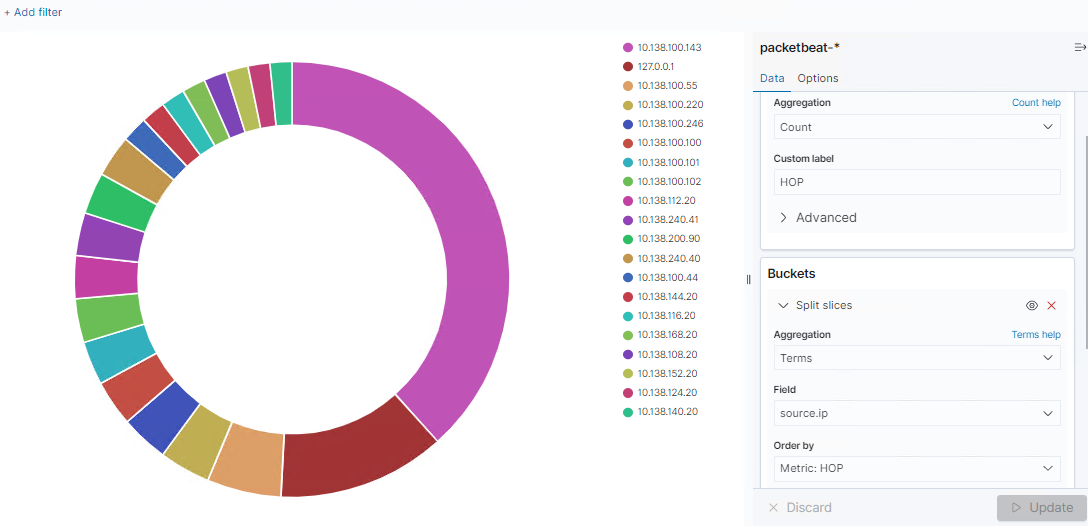
Thats good, it likely means we just need to configure the dashboard visualization to show the correct data. Could you show me a screenshot and perhaps the config of the visualization you'd like to alter?
I try to setup up different options, but without success. I tested with the options that appear with the IP tag. Do I need setup the numeric IP?
I am totally confused. Do I need to log the external IP into the index? If so, how can I do this? I cannot understand why External IPs do not appear, as they appear in Discover.
Do you know which index patter is being used for these visualizations? It should be displayed in the upper left of the dashboard. Once you have that go and look at the index pattern in stack management to verify the field is listed.
Discover can display fields that are in docs but aren't individually stored. That might be what we have here.
The default index pattern is Filebeat. But I also use Packetbeat and Metricbeat. For this specific view, I'm using the Packetbeat index pattern. All my indexes use some Beat (filebeat, metricbeat and packetbeat).
The question:
My HaProxy logs are saved in a Log Centralizer. Then I put the log path from the Log Centralizer, in the beat configuration file. About the External IP in some field, I don't know how to proceed. I thought Beat would do that automatically.
I think your expectations are good but we should still double check that things are in the correct state. Can you look at the field list for the respective index pattern in index pattern management?
You can also go to 'Index Management' inside stack management, find an appropriate index and look at its Mappings - you should find the field you're looking for listed there. If so, please share its entry.
A friend told me that if the external IP appears in the log, then I just had to include it in a specific field in the kibana. My stack works fine for me. I can create any dashboard according to my intention. However, viewing the External IP captured by Haproxy, it's been a headache.
It looks to me like the message field has the whole log line and therefore isn't useful for a number of use cases. Is there a field that only has the external ip address?
Apache, Apache Lucene, Apache Hadoop, Hadoop, HDFS and the yellow elephant
logo are trademarks of the
Apache Software Foundation
in the United States and/or other countries.