Hi everyone,
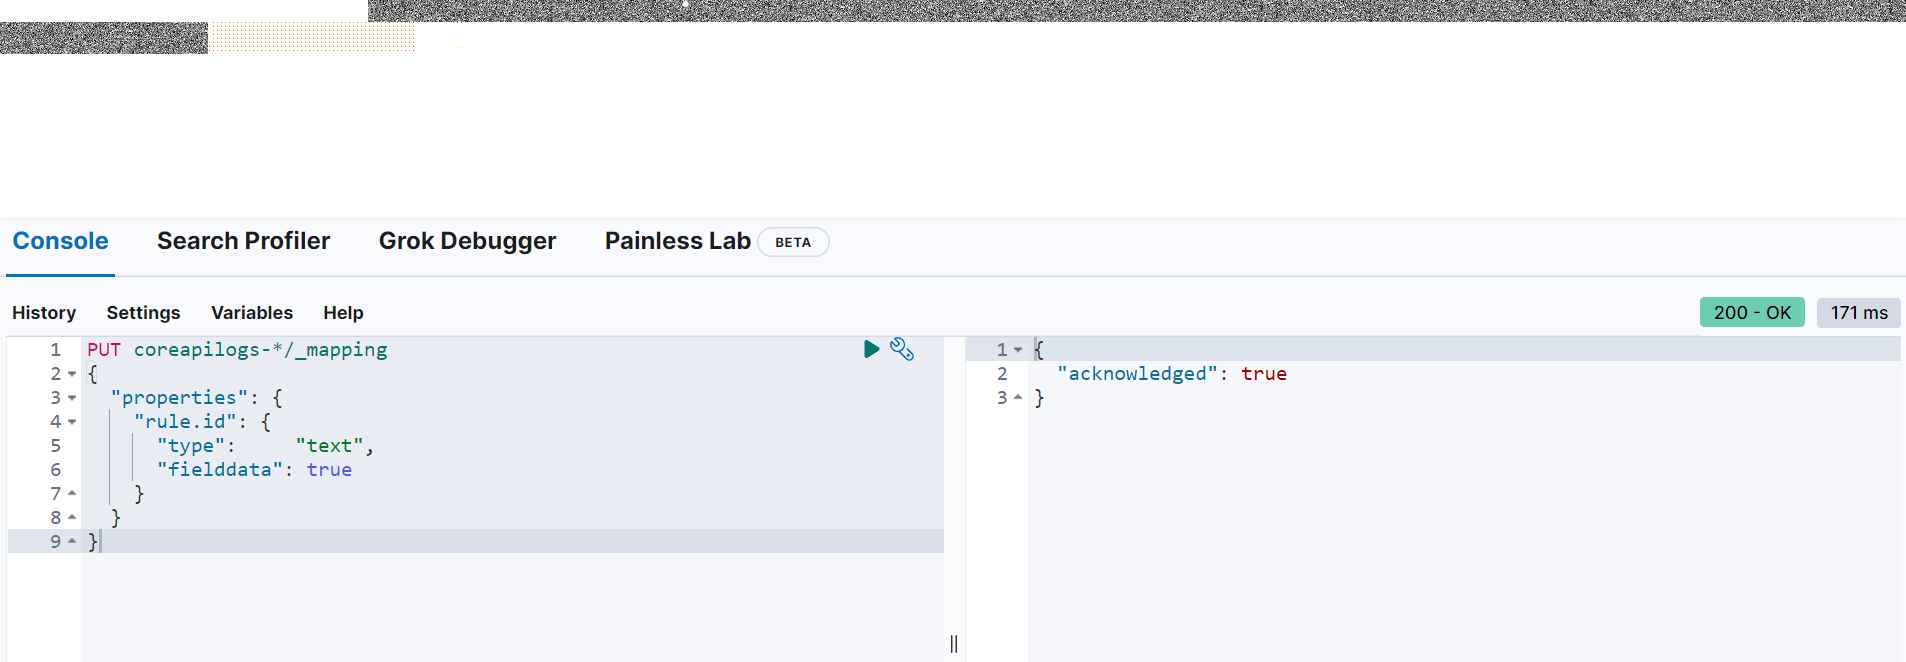
I'm using ELK stack version 8.4.0 and i need to extract logs data from message field that is something like "ERRORS" "EXCEPTIONS" etc and i want a new field for every extracted value so that i can easily create a dashboard.
Please check below logs, your help would be highly appreciated.
Dec 7, 2022 @ 15:21:15.978
- @timestamp, column 3, row 1
2022-12-07 15:21:13,666 [INFO] [Thread-38] CommunicationController - Communication monitor is going to sleep for [30] seconds.
-
message, column 4, row 1
-
openDetails, column 1, row 2
-
select, column 2, row 2
Dec 7, 2022 @ 15:21:15.977
- @timestamp, column 3, row 2
2022-12-07 15:21:13,666 [WARN] [Thread-38] ChannelConnection - ECHO is required but it is not enabled for
-
message, column 4, row 2
-
openDetails, column 1, row 3
-
select, column 2, row 3
Dec 7, 2022 @ 15:21:15.976
- @timestamp, column 3, row 3
2022-12-07 15:21:13,666 [INFO] [Thread-38] ChannelConnection - Socket is idle for the past [180] seconds on
-
message, column 4, row 3
-
openDetails, column 1, row 4
-
select, column 2, row 4
Dec 7, 2022 @ 15:21:15.975
- @timestamp, column 3, row 4
2022-12-07 15:21:13,666 [WARN] [Thread-38] ChannelConnection - SIGN-ON is not enabled for MYHSSM
type or paste code here
-
message, column 4, row 4
-
openDetails, column 1, row 5
-
select, column 2, row 5
Dec 7, 2022 @ 15:21:15.974
- @timestamp, column 3, row 5
2022-12-07 15:21:13,666 [DEBUG] [Thread-38] ChannelConnection - Checking if SIGN-ON is required for MYHSM
-
message, column 4, row 5
-
openDetails, column 1, row 6
-
select, column 2, row 6
Dec 7, 2022 @ 15:21:15.973
- @timestamp, column 3, row 6
2022-12-07 15:21:13,666 [INFO] [Thread-38] ChannelConnection - Monitoring connection state of MYHSM
-
message, column 4, row 6
-
openDetails, column 1, row 7
-
select, column 2, row 7
Dec 7, 2022 @ 15:21:15.972
- @timestamp, column 3, row 7
2022-12-07 15:21:13,666 [INFO] [Thread-38] CommunicationController - [1] connection(s) are active on channel [MYHSM_GATEWAY_CLIENT_C1]: [Client Channel [MYHSM_GATEWAY_CLIENT_C1] on Socket
-
message, column 4, row 7
-
openDetails, column 1, row 8
-
select, column 2, row 8
Dec 7, 2022 @ 15:21:15.971
-
@timestamp, column 3, row 8
-
message, column 4, row 8
-
openDetails, column 1, row 9
-
select, column 2, row 9
Dec 7, 2022 @ 15:21:15.970
- @timestamp, column 3, row 9
2022-12-07 15:21:13,665 [INFO] [Thread-38] CommunicationController - CommunicationMonitor is resuming monitoring for host [MYHSM_GATEWAY_CLIENT]
-
message, column 4, row 9
-
openDetails, column 1, row 10
-
select, column 2, row 10
Dec 7, 2022 @ 15:21:00.965
- @timestamp, column 3, row 10
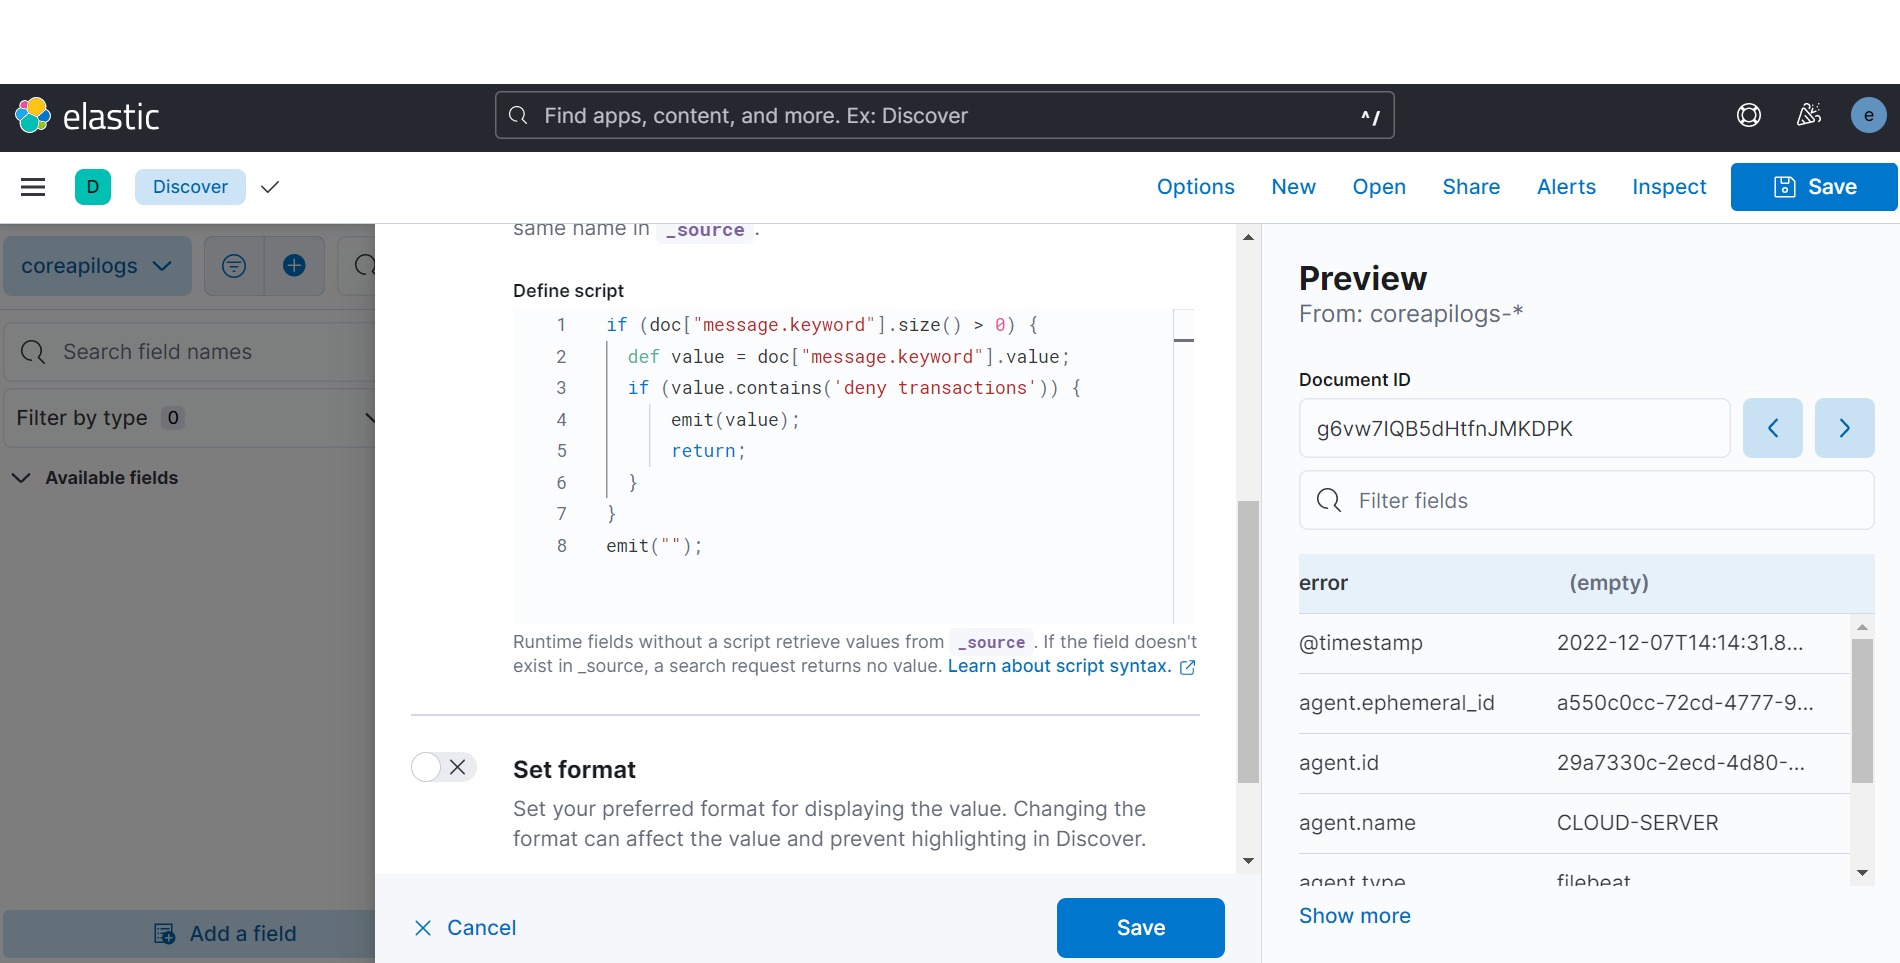
2022-12-07 15:20:59,028 [INFO] [Thread-33] ExecutionTimeLogger - Resuming logging of transaction execution times details & summary
I want to extract a value like "Resuming logging of transaction execution times details" and want to have a field separate field named "resuming logging".
Please help i'm stuck in it for last 3 days. thanks!