Facing connection closer error while starting elasticsearch 8.5.1 instance on local machine

Facing connection closer error while starting elasticsearch 8.5.1 instance on local machine

after starting elasticsearch 8.5.1 (bin/elasticsearch) it is showing below message on terminal,

2024-05-16T22:36:33,888][WARN ][o.e.x.s.t.n.SecurityNetty4HttpServerTransport] [Sunils-MacBook-Pro.local] http client did not trust this server's certificate, closing connection Netty4HttpChannel{localAddress=/[0:0:0:0:0:0:0:1]:9200, remoteAddress=/[0:0:0:0:0:0:0:1]:51183}

the connectivity between kibana & elasticsearch is not happening,
I suspect there is some configuration setting need to be done.

Let me know if somebody have idea regarding the same.

First. Don't use this version. It's a bit old. Better to start with the latest 8.13 as you are running all that locally.
BTW, I'd use docker compose as it's much easier to run all that locally.

Most likely you are using self-signed certificates (by default). So you need to tell Kibana about this. Have a look at Start the Elastic Stack with security enabled automatically | Elasticsearch Guide [8.13] | Elastic

1 Like

Thanks for reply David,

I am checking that where to keep the token while starting the kibana in "Kibana plugin development environment" on or before "yarn kbn bootstrap" / "yarn start"

OR Is there is any file where I can place the elasticsearch token before "yarn kbn bootstrap" ?

I am getting below error when I am starting kibana using "yarn start"

2024-05-17T16:44:25.773+05:30][ERROR][elasticsearch-service] Unable to retrieve version information from Elasticsearch nodes. socket hang up - Local: 127.0.0.1:57905, Remote: 127.0.0.1:9200

Can someone help ?

I am getting an error :

[2024-05-20T12:35:33.915+05:30][ERROR][elasticsearch-service] Unable to retrieve version information from Elasticsearch nodes. socket hang up - Local: 127.0.0.1:62954, Remote: 127.0.0.1:9200

even after adding token to kibana.yml (elasticsearch.serviceAccountToken: "My_Token")

On elasticsearch side I can see below message :

[2024-05-20T12:35:35,306][WARN ][o.e.x.s.t.n.SecurityNetty4HttpServerTransport] [Sunils-MacBook-Pro.local] received plaintext http traffic on an https channel, closing connection Netty4HttpChannel{localAddress=/127.0.0.1:9200, remoteAddress=/127.0.0.1:62962}

After installing fresh kibana tool on local above error gone and I am able to login to Kibana - but still getting below error messages on terminal & it is getting terminated automatically,

[2024-05-20T13:39:29.542+05:30][INFO ][status] Kibana is now available (was degraded)
[2024-05-20T13:39:34.065+05:30][INFO ][plugins.security.routes] Logging in with provider "basic" (basic)
[2024-05-20T13:40:11.261+05:30][ERROR][plugins.taskManager] Failed to poll for work: Error: work has timed out
[2024-05-20T13:40:11.483+05:30][INFO ][status] Kibana is now degraded (was available)
[2024-05-20T13:40:13.735+05:30][ERROR][elasticsearch-service] Unable to retrieve version information from Elasticsearch nodes. Request timed out
[2024-05-20T13:40:17.080+05:30][INFO ][status] Kibana is now available (was degraded)
[2024-05-20T13:41:07.897+05:30][ERROR][plugins.taskManager] Failed to poll for work: Error: work has timed out
[2024-05-20T13:41:26.292+05:30][INFO ][status] Kibana is now degraded (was available)
[2024-05-20T13:41:37.910+05:30][ERROR][plugins.taskManager] Failed to poll for work: Error: work has timed out
[2024-05-20T13:41:51.351+05:30][WARN ][plugins.kibanaUsageCollection.usage-counters-rollup] Failed to rollup Usage Counters saved objects.
[2024-05-20T13:41:51.358+05:30][WARN ][plugins.kibanaUsageCollection.usage-counters-rollup] TimeoutError: Request timed out
    at KibanaTransport.request (/Users/sunil/Documents/workspace/kibana-8.5.1/node_modules/@elastic/transport/lib/Transport.js:524:31)
    at runMicrotasks (<anonymous>)
    at processTicksAndRejections (node:internal/process/task_queues:96:5)
    at runNextTicks (node:internal/process/task_queues:65:3)
    at listOnTimeout (node:internal/timers:528:9)
    at processTimers (node:internal/timers:502:7)
    at KibanaTransport.request (/Users/sunil/Documents/workspace/kibana-8.5.1/node_modules/@kbn/core-elasticsearch-client-server-internal/target_node/src/create_transport.js:58:16)
    at ClientTraced.SearchApi [as search] (/Users/sunil/Documents/workspace/kibana-8.5.1/node_modules/@elastic/elasticsearch/lib/api/api/search.js:65:12)
[2024-05-20T13:41:51.369+05:30][ERROR][savedobjects-service.repository.point-in-time-finder] Failed to open PIT for types [application_usage_totals]
[2024-05-20T13:41:51.370+05:30][ERROR][savedobjects-service.repository.point-in-time-finder] Failed to open PIT for types [application_usage_daily]
TimeoutError: Request timed out
    at KibanaTransport.request (/Users/sunil/Documents/workspace/kibana-8.5.1/node_modules/@elastic/transport/lib/Transport.js:524:31)
    at runMicrotasks (<anonymous>)
    at processTicksAndRejections (node:internal/process/task_queues:96:5)
    at KibanaTransport.request (/Users/sunil/Documents/workspace/kibana-8.5.1/node_modules/@kbn/core-elasticsearch-client-server-internal/target_node/src/create_transport.js:58:16)
    at ClientTraced.GetApi [as get] (/Users/sunil/Documents/workspace/kibana-8.5.1/node_modules/@elastic/elasticsearch/lib/api/api/get.js:36:12) {
  meta: {
    body: undefined,
    statusCode: 0,
    headers: {},
    meta: {
      context: null,
      request: [Object],
      name: 'elasticsearch-js',
      connection: [Object],
      attempts: 0,
      aborted: false
    },
    warnings: [Getter]
  },
  isBoom: true,
  isServer: true,
  data: null,
  output: {
    statusCode: 503,
    payload: {
      statusCode: 503,
      error: 'Service Unavailable',
      message: 'Request timed out'
    },
    headers: {}
  },
  [Symbol(SavedObjectsClientErrorCode)]: 'SavedObjectsClient/esUnavailable'
}
Sunils-MacBook-Pro:kibana-8.5.1 sunil$ 

and on elsticsearch side, I can see below error messages,

2024-05-20T13:41:47,109][INFO ][o.e.c.m.MetadataMappingService] [Sunils-MacBook-Pro.local] [.kibana_8.5.1_001/0JoAA0UnSti3alGzV7sOug] update_mapping [_doc]
[2024-05-20T13:42:41,352][WARN ][o.e.h.AbstractHttpServerTransport] [Sunils-MacBook-Pro.local] caught exception while handling client http traffic, closing connection Netty4HttpChannel{localAddress=/9.243.230.120:9200, remoteAddress=/9.243.230.120:64782}java.io.IOException: Operation timed out
	at java.base/sun.nio.ch.SocketDispatcher.read0(Native Method)
	at java.base/sun.nio.ch.SocketDispatcher.read(SocketDispatcher.java:47)
	at java.base/sun.nio.ch.IOUtil.readIntoNativeBuffer(IOUtil.java:339)
	at java.base/sun.nio.ch.IOUtil.read(IOUtil.java:293)
	at java.base/sun.nio.ch.IOUtil.read(IOUtil.java:268)

See logs for more details.

In kibana plugin development environment, I am able to do "yarn kbn bootstarp"
and after "yar start" I am able to reach to login screen,

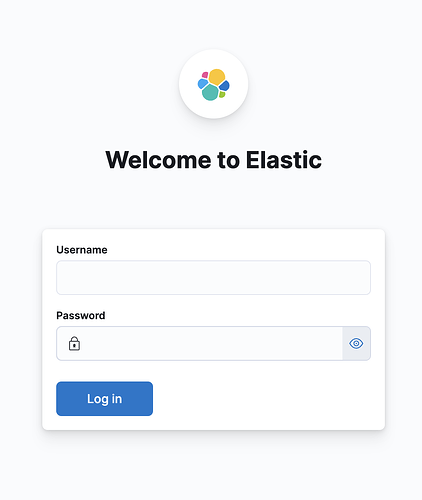
but after entering credentials and clicking on login button it is giving me the same login window.

testing kibana & elasticsearch version 8.5.1

below is the messages on kiban terminal :

[2024-05-20T15:08:10.753+05:30][INFO ][status] Kibana is now available (was degraded)
[2024-05-20T15:08:10.789+05:30][INFO ][plugins.ml] Task ML:saved-objects-sync-task: No ML saved objects in need of synchronization
[2024-05-20T15:08:54.804+05:30][INFO ][plugins.security.routes] Logging in with provider "basic" (basic)

and below is the messages on elasticsearch terminal :

2024-05-20T15:08:06,323][INFO ][o.e.t.LoggingTaskListener] [Sunils-MacBook-Pro.local] 4525 finished with response BulkByScrollResponse[took=171.5ms,timed_out=false,sliceId=null,updated=126,created=0,deleted=0,batches=1,versionConflicts=0,noops=0,retries=0,throttledUntil=0s,bulk_failures=[],search_failures=[]]
[2024-05-20T15:08:54,965][INFO ][o.e.x.s.s.SecurityIndexManager] [Sunils-MacBook-Pro.local] security index does not exist, creating [.security-profile-8] with alias [.security-profile]
[2024-05-20T15:08:55,035][INFO ][o.e.c.m.MetadataCreateIndexService] [Sunils-MacBook-Pro.local] [.security-profile-8] creating index, cause [api], templates [], shards [1]/[0]
[2024-05-20T15:08:55,211][INFO ][o.e.c.r.a.AllocationService] [Sunils-MacBook-Pro.local] current.health="GREEN" message="Cluster health status changed from [YELLOW] to [GREEN] (reason: [shards started [[.security-profile-8][0]]])." previous.health="YELLOW" reason="shards started [[.security-profile-8][0]]"
[2024-05-20T15:13:08,097][INFO ][o.e.c.m.MetadataMappingService] [Sunils-MacBook-Pro.local] [.kibana_8.5.1_001/yg23-gQcS9-brtZXAEA5yg] update_mapping [_doc]

FYI : I copied below lines from kibana-8.5.1 original tool to Kibana plugin development environment project on same location i.e. : config/kibana.yml

elasticsearch.hosts: ['https://192.168.0.101:9200']
elasticsearch.serviceAccountToken: ENCRTYPTED_TEXT
elasticsearch.ssl.certificateAuthorities: [/Users/sunil/Documents/workspace/kibana/data/ca_1716197632521.crt]
xpack.fleet.outputs: [{id: fleet-default-output, name: default, is_default: true, is_default_monitoring: true, type: elasticsearch, hosts: ['https://192.168.0.101:9200'], ca_trusted_fingerprint: ENCRTYPTED_TEXT}]
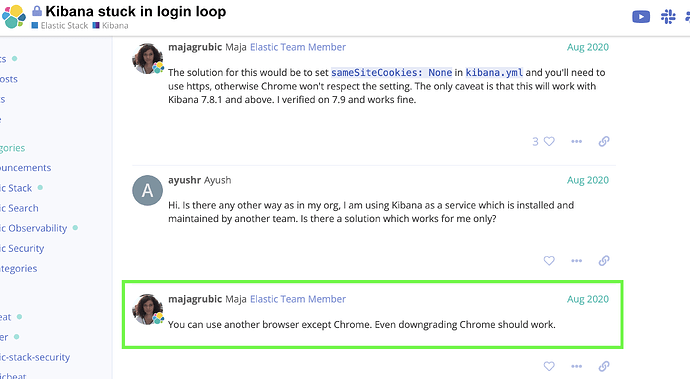
As per below post, it is working in other web browsers than Google Chrome,

Thank you.