I have installed filebeat version 7.6.2.
My elastic cluster nodes also have vesion 7.6.2 in kibana end elastic search.
My filebeat yamlfile is the following:
###################### Filebeat Configuration Example #########################

# This file is an example configuration file highlighting only the most common
# options. The filebeat.reference.yml file from the same directory contains all the
# supported options with more comments. You can use it as a reference.
#
# You can find the full configuration reference here:
# https://www.elastic.co/guide/en/beats/filebeat/index.html

# For more available modules and options, please see the filebeat.reference.yml sample
# configuration file.

#=========================== Filebeat inputs =============================

filebeat.inputs:

# Each - is an input. Most options can be set at the input level, so
# you can use different inputs for various configurations.
# Below are the input specific configurations.

- type: log

  # Change to true to enable this input configuration.
  enabled: true

  # Paths that should be crawled and fetched. Glob based paths.
  paths:
    - /var/log/logstash/*.log
    #- c:\programdata\elasticsearch\logs\*

  # Exclude lines. A list of regular expressions to match. It drops the lines that are
  # matching any regular expression from the list.
  #exclude_lines: ['^DBG']

  # Include lines. A list of regular expressions to match. It exports the lines that are
  # matching any regular expression from the list.
  #include_lines: ['^ERR', '^WARN']

  # Exclude files. A list of regular expressions to match. Filebeat drops the files that
  # are matching any regular expression from the list. By default, no files are dropped.
  #exclude_files: ['.gz$']

  # Optional additional fields. These fields can be freely picked
  # to add additional information to the crawled log files for filtering
  #fields:
  #  level: debug
  #  review: 1

  ### Multiline options

  # Multiline can be used for log messages spanning multiple lines. This is common
  # for Java Stack Traces or C-Line Continuation

  # The regexp Pattern that has to be matched. The example pattern matches all lines starting with [
  multiline.pattern: ^\[

  # Defines if the pattern set under pattern should be negated or not. Default is false.
  multiline.negate: true

  # Match can be set to "after" or "before". It is used to define if lines should be append to a pattern
  # that was (not) matched before or after or as long as a pattern is not matched based on negate.
  # Note: After is the equivalent to previous and before is the equivalent to to next in Logstash
  multiline.match: after


#============================= Filebeat modules ===============================

filebeat.config.modules:
  # Glob pattern for configuration loading
  path: ${path.config}/modules.d/*.yml

  # Set to true to enable config reloading
  reload.enabled: false

  # Period on which files under path should be checked for changes
  #reload.period: 10s

#==================== Elasticsearch template setting ==========================

setup.template.settings:
  index.number_of_shards: 1
  #index.codec: best_compression
  #_source.enabled: false

#================================ General =====================================

# The name of the shipper that publishes the network data. It can be used to group
# all the transactions sent by a single shipper in the web interface.
#name:

# The tags of the shipper are included in their own field with each
# transaction published.
#tags: ["service-X", "web-tier"]

# Optional fields that you can specify to add additional information to the
# output.
#fields:
#  env: staging


#============================== Dashboards =====================================
# These settings control loading the sample dashboards to the Kibana index. Loading
# the dashboards is disabled by default and can be enabled either by setting the
# options here or by using the `setup` command.
setup.dashboards.enabled: true

# The URL from where to download the dashboards archive. By default this URL
# has a value which is computed based on the Beat name and version. For released
# versions, this URL points to the dashboard archive on the artifacts.elastic.co
# website.
#setup.dashboards.url:

#============================== Kibana =====================================

# Starting with Beats version 6.0.0, the dashboards are loaded via the Kibana API.
# This requires a Kibana endpoint configuration.
setup.kibana:

  # Kibana Host
  # Scheme and port can be left out and will be set to the default (http and 5601)
  # In case you specify and additional path, the scheme is required: http://localhost:5601/path
  # IPv6 addresses should always be defined as: https://[2001:db8::1]:5601
  host: "10.1.163.51:5601"

  # Kibana Space ID
  # ID of the Kibana Space into which the dashboards should be loaded. By default,
  # the Default Space will be used.
  space.id: "monitoring"

#============================= Elastic Cloud ==================================

# These settings simplify using Filebeat with the Elastic Cloud (https://cloud.elastic.co/).

# The cloud.id setting overwrites the `output.elasticsearch.hosts` and
# `setup.kibana.host` options.
# You can find the `cloud.id` in the Elastic Cloud web UI.
#cloud.id:

# The cloud.auth setting overwrites the `output.elasticsearch.username` and
# `output.elasticsearch.password` settings. The format is `<user>:<pass>`.
#cloud.auth:

#================================ Outputs =====================================

# Configure what output to use when sending the data collected by the beat.

#-------------------------- Elasticsearch output ------------------------------
output.elasticsearch:
  # Array of hosts to connect to.
  hosts: "sag-prd-es-002.sag.services:9200"

  # Protocol - either `http` (default) or `https`.
  #protocol: "https"

  # Authentication credentials - either API key or username/password.
  #api_key: "id:api_key"
  username: "myusername"
  password: "mypass"

#----------------------------- Logstash output --------------------------------
#output.logstash:
  # The Logstash hosts
  #hosts: ["localhost:5044"]

  # Optional SSL. By default is off.
  # List of root certificates for HTTPS server verifications
  #ssl.certificate_authorities: ["/etc/pki/root/ca.pem"]

  # Certificate for SSL client authentication
  #ssl.certificate: "/etc/pki/client/cert.pem"

  # Client Certificate Key
  #ssl.key: "/etc/pki/client/cert.key"

#================================ Processors =====================================

# Configure processors to enhance or manipulate events generated by the beat.

processors:
  - add_host_metadata: ~
  - add_cloud_metadata: ~
  - add_docker_metadata: ~
  - add_kubernetes_metadata: ~

#================================ Logging =====================================

# Sets log level. The default log level is info.
# Available log levels are: error, warning, info, debug
#logging.level: debug

# At debug level, you can selectively enable logging only for some components.
# To enable all selectors use ["*"]. Examples of other selectors are "beat",
# "publish", "service".
#logging.selectors: ["*"]

#============================== X-Pack Monitoring ===============================
# filebeat can export internal metrics to a central Elasticsearch monitoring
# cluster.  This requires xpack monitoring to be enabled in Elasticsearch.  The
# reporting is disabled by default.

# Set to true to enable the monitoring reporter.
#monitoring.enabled: false

# Sets the UUID of the Elasticsearch cluster under which monitoring data for this
# Filebeat instance will appear in the Stack Monitoring UI. If output.elasticsearch
# is enabled, the UUID is derived from the Elasticsearch cluster referenced by output.elasticsearch.
#monitoring.cluster_uuid:

# Uncomment to send the metrics to Elasticsearch. Most settings from the
# Elasticsearch output are accepted here as well.
# Note that the settings should point to your Elasticsearch *monitoring* cluster.
# Any setting that is not set is automatically inherited from the Elasticsearch
# output configuration, so if you have the Elasticsearch output configured such
# that it is pointing to your Elasticsearch monitoring cluster, you can simply
# uncomment the following line.
#monitoring.elasticsearch:

#================================= Migration ==================================

# This allows to enable 6.7 migration aliases
#migration.6_to_7.enabled: true
My logstash module yml is enabled and is like that:
- module: logstash
  # logs
  log:
    enabled: true

    # Set custom paths for the log files. If left empty,
    # Filebeat will choose the paths depending on your OS.
    #var.paths: ["/var/log/logstash/*.log"]

  # Slow logs
  slowlog:
    enabled: true
    # Set custom paths for the log files. If left empty,
    # Filebeat will choose the paths depending on your OS.
    #var.paths: ["/var/log/logstash/*.log"]
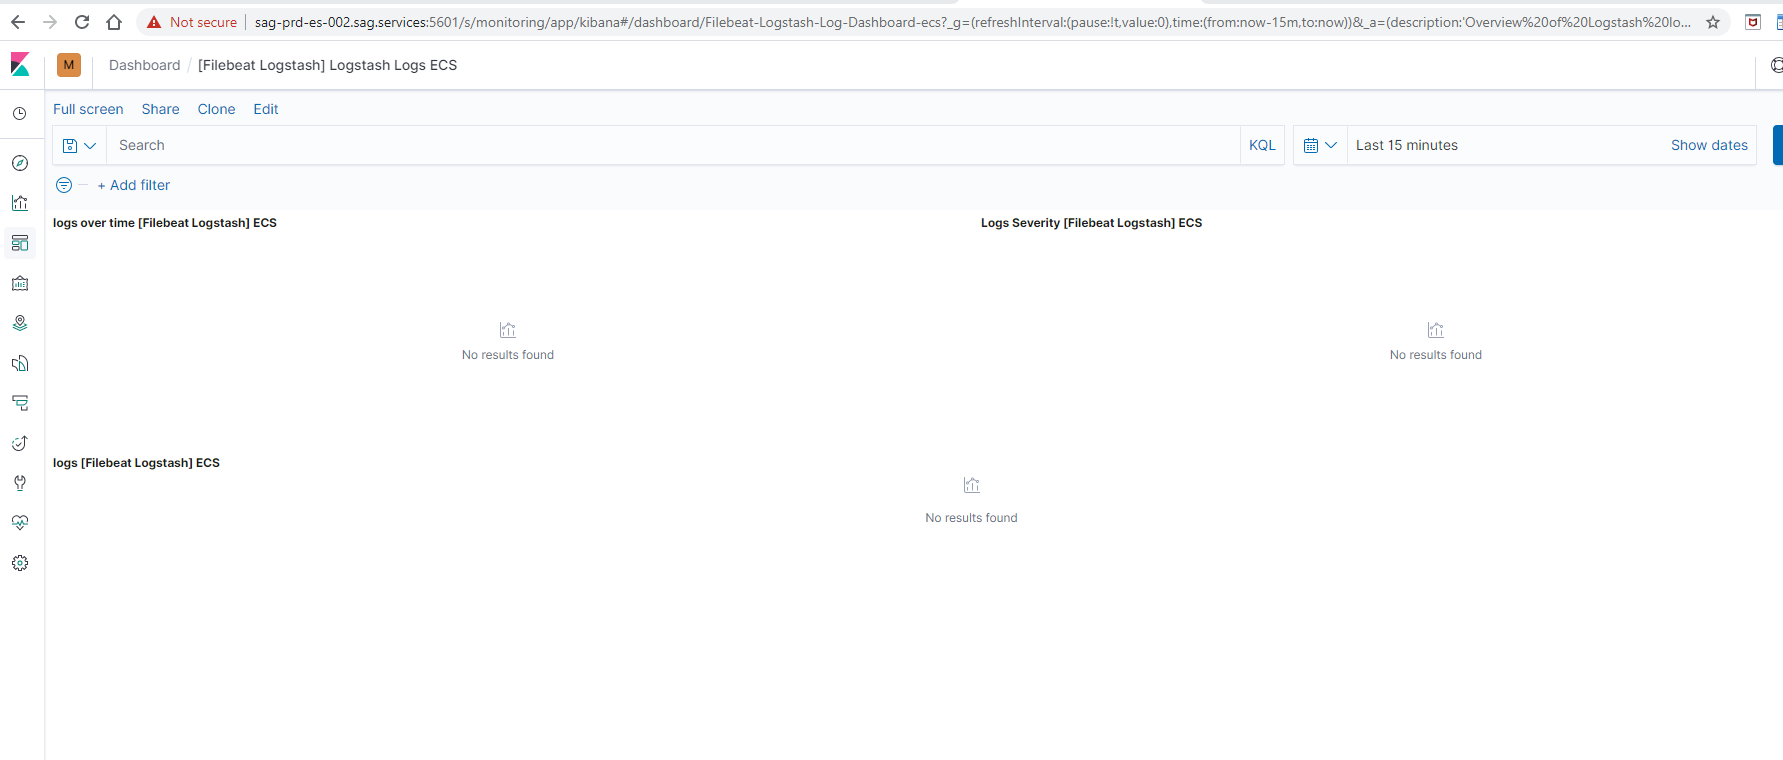
Even though i receive filebeat logs they are not parsed by loglevel as the image shows below:
The log level is collected by the logstash module in the log.level field, I see you are looking for a LogLevel field in Kibana. I wonder where this field comes from.
I see that you are using the logstash module, but you have also defined an input collecting the same files. The input maybe collecting the logs without doing any parsing, and it shouldn't be needed, as the module defines its own inputs. so I recommend you to remove the input configuration for logstash logs.
Check if, after removing the input, the log.level field is available, and something improves with the dashboards.
At the past we had installed filebeat in a host outside of the elastic cluster in order to monitor him, thats probably why you see the LogLevel field in Kibana.
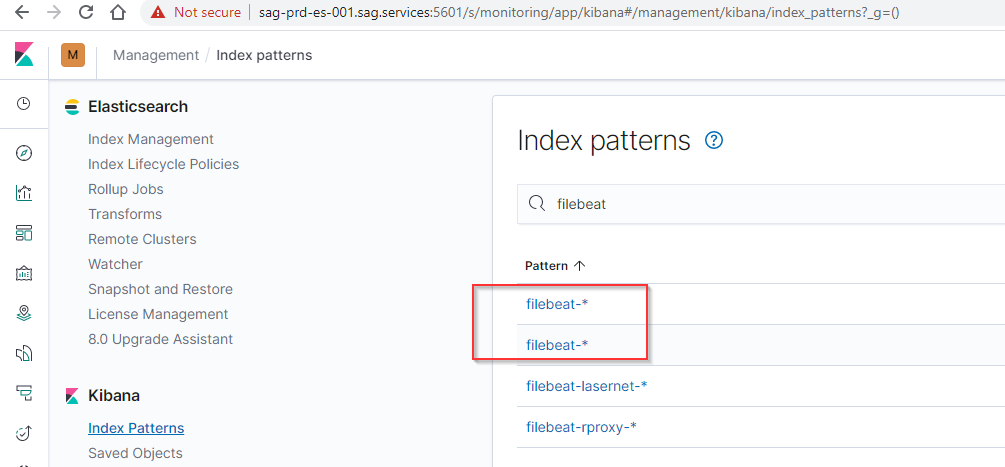
The weird thing is that i see 2 times the filebeat index:
Concerning your second bullet what you say makes absolute sense.
Thats why i have now my filebeat yaml file like that:
###################### Filebeat Configuration Example #########################

# This file is an example configuration file highlighting only the most common
# options. The filebeat.reference.yml file from the same directory contains all the
# supported options with more comments. You can use it as a reference.
#
# You can find the full configuration reference here:
# https://www.elastic.co/guide/en/beats/filebeat/index.html

# For more available modules and options, please see the filebeat.reference.yml sample
# configuration file.

#=========================== Filebeat inputs =============================

filebeat.inputs:

# Each - is an input. Most options can be set at the input level, so
# you can use different inputs for various configurations.
# Below are the input specific configurations.

- type: log

  # Change to true to enable this input configuration.
  #enabled: true

  # Paths that should be crawled and fetched. Glob based paths.
  paths:
    #- /var/log/logstash/*.log
    #- c:\programdata\elasticsearch\logs\*

  # Exclude lines. A list of regular expressions to match. It drops the lines that are
  # matching any regular expression from the list.
  #exclude_lines: ['^DBG']

  # Include lines. A list of regular expressions to match. It exports the lines that are
  # matching any regular expression from the list.
  #include_lines: ['^ERR', '^WARN']

  # Exclude files. A list of regular expressions to match. Filebeat drops the files that
  # are matching any regular expression from the list. By default, no files are dropped.
  #exclude_files: ['.gz$']

  # Optional additional fields. These fields can be freely picked
  # to add additional information to the crawled log files for filtering
  #fields:
  #  level: debug
  #  review: 1

  ### Multiline options

  # Multiline can be used for log messages spanning multiple lines. This is common
  # for Java Stack Traces or C-Line Continuation

  # The regexp Pattern that has to be matched. The example pattern matches all lines starting with [
  multiline.pattern: ^\[

  # Defines if the pattern set under pattern should be negated or not. Default is false.
  multiline.negate: true

  # Match can be set to "after" or "before". It is used to define if lines should be append to a pattern
  # that was (not) matched before or after or as long as a pattern is not matched based on negate.
  # Note: After is the equivalent to previous and before is the equivalent to to next in Logstash
  multiline.match: after


#============================= Filebeat modules ===============================

filebeat.config.modules:
  # Glob pattern for configuration loading
  path: ${path.config}/modules.d/*.yml

  # Set to true to enable config reloading
  reload.enabled: false

  # Period on which files under path should be checked for changes
  #reload.period: 10s

#==================== Elasticsearch template setting ==========================

setup.template.settings:
  index.number_of_shards: 1
  #index.codec: best_compression
  #_source.enabled: false

#================================ General =====================================

# The name of the shipper that publishes the network data. It can be used to group
# all the transactions sent by a single shipper in the web interface.
#name:

# The tags of the shipper are included in their own field with each
# transaction published.
#tags: ["service-X", "web-tier"]

# Optional fields that you can specify to add additional information to the
# output.
#fields:
#  env: staging


#============================== Dashboards =====================================
# These settings control loading the sample dashboards to the Kibana index. Loading
# the dashboards is disabled by default and can be enabled either by setting the
# options here or by using the `setup` command.
setup.dashboards.enabled: true

# The URL from where to download the dashboards archive. By default this URL
# has a value which is computed based on the Beat name and version. For released
# versions, this URL points to the dashboard archive on the artifacts.elastic.co
# website.
#setup.dashboards.url:

#============================== Kibana =====================================

# Starting with Beats version 6.0.0, the dashboards are loaded via the Kibana API.
# This requires a Kibana endpoint configuration.
setup.kibana:

  # Kibana Host
  # Scheme and port can be left out and will be set to the default (http and 5601)
  # In case you specify and additional path, the scheme is required: http://localhost:5601/path
  # IPv6 addresses should always be defined as: https://[2001:db8::1]:5601
  host: "10.1.163.51:5601"

  # Kibana Space ID
  # ID of the Kibana Space into which the dashboards should be loaded. By default,
  # the Default Space will be used.
  space.id: "monitoring"

#============================= Elastic Cloud ==================================

# These settings simplify using Filebeat with the Elastic Cloud (https://cloud.elastic.co/).

# The cloud.id setting overwrites the `output.elasticsearch.hosts` and
# `setup.kibana.host` options.
# You can find the `cloud.id` in the Elastic Cloud web UI.
#cloud.id:

# The cloud.auth setting overwrites the `output.elasticsearch.username` and
# `output.elasticsearch.password` settings. The format is `<user>:<pass>`.
#cloud.auth:

#================================ Outputs =====================================

# Configure what output to use when sending the data collected by the beat.

#-------------------------- Elasticsearch output ------------------------------
output.elasticsearch:
  # Array of hosts to connect to.
  hosts: "sag-prd-es-002.sag.services:9200"

  # Protocol - either `http` (default) or `https`.
  #protocol: "https"

  # Authentication credentials - either API key or username/password.
  #api_key: "id:api_key"
  username: "myusername"
  password: "mypass"

#----------------------------- Logstash output --------------------------------
#output.logstash:
  # The Logstash hosts
  #hosts: ["localhost:5044"]

  # Optional SSL. By default is off.
  # List of root certificates for HTTPS server verifications
  #ssl.certificate_authorities: ["/etc/pki/root/ca.pem"]

  # Certificate for SSL client authentication
  #ssl.certificate: "/etc/pki/client/cert.pem"

  # Client Certificate Key
  #ssl.key: "/etc/pki/client/cert.key"

#================================ Processors =====================================

# Configure processors to enhance or manipulate events generated by the beat.

processors:
  - add_host_metadata: ~
  - add_cloud_metadata: ~
  - add_docker_metadata: ~
  - add_kubernetes_metadata: ~

#================================ Logging =====================================

# Sets log level. The default log level is info.
# Available log levels are: error, warning, info, debug
#logging.level: debug

# At debug level, you can selectively enable logging only for some components.
# To enable all selectors use ["*"]. Examples of other selectors are "beat",
# "publish", "service".
#logging.selectors: ["*"]

#============================== X-Pack Monitoring ===============================
# filebeat can export internal metrics to a central Elasticsearch monitoring
# cluster.  This requires xpack monitoring to be enabled in Elasticsearch.  The
# reporting is disabled by default.

# Set to true to enable the monitoring reporter.
#monitoring.enabled: false

# Sets the UUID of the Elasticsearch cluster under which monitoring data for this
# Filebeat instance will appear in the Stack Monitoring UI. If output.elasticsearch
# is enabled, the UUID is derived from the Elasticsearch cluster referenced by output.elasticsearch.
#monitoring.cluster_uuid:

# Uncomment to send the metrics to Elasticsearch. Most settings from the
# Elasticsearch output are accepted here as well.
# Note that the settings should point to your Elasticsearch *monitoring* cluster.
# Any setting that is not set is automatically inherited from the Elasticsearch
# output configuration, so if you have the Elasticsearch output configured such
# that it is pointing to your Elasticsearch monitoring cluster, you can simply
# uncomment the following line.
#monitoring.elasticsearch:

#================================= Migration ==================================

# This allows to enable 6.7 migration aliases
#migration.6_to_7.enabled: true
and my logstash module yml file like that:
- module: logstash
  # logs
  log:
    enabled: true

    # Set custom paths for the log files. If left empty,
    # Filebeat will choose the paths depending on your OS.
    var.paths: ["/var/log/logstash/logstash-plain*.log"]

  # Slow logs
  slowlog:
    enabled: true
    # Set custom paths for the log files. If left empty,
    # Filebeat will choose the paths depending on your OS.
    var.paths: ["/var/log/logstash/logstash-slowlog*.log"]
I configured the paths that way because as the image show below i have these types of logs in the path: /var/log/logstash
The two index patterns can be caused by creating one manually, and another one with filebeat setup. Internally they will have different identifiers. You can probably remove the one with the mapping conflict. Another option is to remove both of them, and run filebeat setup again. In any case this shouldn't be a problem for data ingestion, these index patterns are only used by Kibana.
Your module configuration looks good, could you check in the filebeat logs if you see anything about the inputs for this module being configured? (You should see something with the paths you have configured).
In Kibana I see that you are filtering by _index, do you have the same results if you remove this filter?
So i have the error: ERROR instance/beat.go:933 Exiting: Error while initializing input: No paths were defined for input accessing 'filebeat.inputs.0' (source:'/etc/filebeat/filebeat.yml')
Exactly after that (and without changing anything in my filebeat configuration) i restarted filebeat and check again its status as the image show below and it is in status enabled:
Nevertheless still no logs received in kibana.... What else shall i try?
If i dont filter in kibana by that specific index name i get logs but that is because i receive the filebeat logs from the servers that we had installed filebeat at the past which are not in our elastic cluster...
###################### Filebeat Configuration Example #########################

# This file is an example configuration file highlighting only the most common
# options. The filebeat.reference.yml file from the same directory contains all the
# supported options with more comments. You can use it as a reference.
#
# You can find the full configuration reference here:
# https://www.elastic.co/guide/en/beats/filebeat/index.html

# For more available modules and options, please see the filebeat.reference.yml sample
# configuration file.

#=========================== Filebeat inputs =============================

filebeat.inputs:

# Each - is an input. Most options can be set at the input level, so
# you can use different inputs for various configurations.
# Below are the input specific configurations.

- type: log

  # Change to true to enable this input configuration.
  #enabled: true

  # Paths that should be crawled and fetched. Glob based paths.
  paths:
    #- /var/log/logstash/*.log
    #- c:\programdata\elasticsearch\logs\*

  # Exclude lines. A list of regular expressions to match. It drops the lines that are
  # matching any regular expression from the list.
  #exclude_lines: ['^DBG']

  # Include lines. A list of regular expressions to match. It exports the lines that are
  # matching any regular expression from the list.
  #include_lines: ['^ERR', '^WARN']

  # Exclude files. A list of regular expressions to match. Filebeat drops the files that
  # are matching any regular expression from the list. By default, no files are dropped.
  #exclude_files: ['.gz$']

  # Optional additional fields. These fields can be freely picked
  # to add additional information to the crawled log files for filtering
  #fields:
  #  level: debug
  #  review: 1

  ### Multiline options

  # Multiline can be used for log messages spanning multiple lines. This is common
  # for Java Stack Traces or C-Line Continuation

  # The regexp Pattern that has to be matched. The example pattern matches all lines starting with [
  multiline.pattern: ^\[

  # Defines if the pattern set under pattern should be negated or not. Default is false.
  multiline.negate: true

  # Match can be set to "after" or "before". It is used to define if lines should be append to a pattern
  # that was (not) matched before or after or as long as a pattern is not matched based on negate.
  # Note: After is the equivalent to previous and before is the equivalent to to next in Logstash
  multiline.match: after


#============================= Filebeat modules ===============================

filebeat.config.modules:
  # Glob pattern for configuration loading
  path: ${path.config}/modules.d/*.yml

  # Set to true to enable config reloading
  reload.enabled: false

  # Period on which files under path should be checked for changes
  #reload.period: 10s

#==================== Elasticsearch template setting ==========================

setup.template.settings:
  index.number_of_shards: 1
  #index.codec: best_compression
  #_source.enabled: false

#================================ General =====================================

# The name of the shipper that publishes the network data. It can be used to group
# all the transactions sent by a single shipper in the web interface.
#name:

# The tags of the shipper are included in their own field with each
# transaction published.
#tags: ["service-X", "web-tier"]

# Optional fields that you can specify to add additional information to the
# output.
#fields:
#  env: staging


#============================== Dashboards =====================================
# These settings control loading the sample dashboards to the Kibana index. Loading
# the dashboards is disabled by default and can be enabled either by setting the
# options here or by using the `setup` command.
setup.dashboards.enabled: true

# The URL from where to download the dashboards archive. By default this URL
# has a value which is computed based on the Beat name and version. For released
# versions, this URL points to the dashboard archive on the artifacts.elastic.co
# website.
#setup.dashboards.url:

#============================== Kibana =====================================

# Starting with Beats version 6.0.0, the dashboards are loaded via the Kibana API.
# This requires a Kibana endpoint configuration.
setup.kibana:

  # Kibana Host
  # Scheme and port can be left out and will be set to the default (http and 5601)
  # In case you specify and additional path, the scheme is required: http://localhost:5601/path
  # IPv6 addresses should always be defined as: https://[2001:db8::1]:5601
  host: "10.1.163.51:5601"

  # Kibana Space ID
  # ID of the Kibana Space into which the dashboards should be loaded. By default,
  # the Default Space will be used.
  space.id: "monitoring"

#============================= Elastic Cloud ==================================

# These settings simplify using Filebeat with the Elastic Cloud (https://cloud.elastic.co/).

# The cloud.id setting overwrites the `output.elasticsearch.hosts` and
# `setup.kibana.host` options.
# You can find the `cloud.id` in the Elastic Cloud web UI.
#cloud.id:

# The cloud.auth setting overwrites the `output.elasticsearch.username` and
# `output.elasticsearch.password` settings. The format is `<user>:<pass>`.
#cloud.auth:

#================================ Outputs =====================================

# Configure what output to use when sending the data collected by the beat.

#-------------------------- Elasticsearch output ------------------------------
output.elasticsearch:
  # Array of hosts to connect to.
  hosts: "sag-prd-es-002.sag.services:9200"

  # Protocol - either `http` (default) or `https`.
  #protocol: "https"

  # Authentication credentials - either API key or username/password.
  #api_key: "id:api_key"
  username: "elastic"
  password: "elastic"

#----------------------------- Logstash output --------------------------------
#output.logstash:
  # The Logstash hosts
  #hosts: ["localhost:5044"]

  # Optional SSL. By default is off.
  # List of root certificates for HTTPS server verifications
  #ssl.certificate_authorities: ["/etc/pki/root/ca.pem"]

  # Certificate for SSL client authentication
  #ssl.certificate: "/etc/pki/client/cert.pem"

  # Client Certificate Key
  #ssl.key: "/etc/pki/client/cert.key"

#================================ Processors =====================================

# Configure processors to enhance or manipulate events generated by the beat.

processors:
  - add_host_metadata: ~
  - add_cloud_metadata: ~
  - add_docker_metadata: ~
  - add_kubernetes_metadata: ~

#================================ Logging =====================================

# Sets log level. The default log level is info.
# Available log levels are: error, warning, info, debug
#logging.level: debug

# At debug level, you can selectively enable logging only for some components.
# To enable all selectors use ["*"]. Examples of other selectors are "beat",
# "publish", "service".
#logging.selectors: ["*"]

#============================== X-Pack Monitoring ===============================
# filebeat can export internal metrics to a central Elasticsearch monitoring
# cluster.  This requires xpack monitoring to be enabled in Elasticsearch.  The
# reporting is disabled by default.

# Set to true to enable the monitoring reporter.
#monitoring.enabled: false

# Sets the UUID of the Elasticsearch cluster under which monitoring data for this
# Filebeat instance will appear in the Stack Monitoring UI. If output.elasticsearch
# is enabled, the UUID is derived from the Elasticsearch cluster referenced by output.elasticsearch.
#monitoring.cluster_uuid:

# Uncomment to send the metrics to Elasticsearch. Most settings from the
# Elasticsearch output are accepted here as well.
# Note that the settings should point to your Elasticsearch *monitoring* cluster.
# Any setting that is not set is automatically inherited from the Elasticsearch
# output configuration, so if you have the Elasticsearch output configured such
# that it is pointing to your Elasticsearch monitoring cluster, you can simply
# uncomment the following line.
#monitoring.elasticsearch:

#================================= Migration ==================================

# This allows to enable 6.7 migration aliases
#migration.6_to_7.enabled: true
###################### Filebeat Configuration Example #########################

# This file is an example configuration file highlighting only the most common
# options. The filebeat.reference.yml file from the same directory contains all the
# supported options with more comments. You can use it as a reference.
#
# You can find the full configuration reference here:
# https://www.elastic.co/guide/en/beats/filebeat/index.html

# For more available modules and options, please see the filebeat.reference.yml sample
# configuration file.

#=========================== Filebeat inputs =============================

filebeat.inputs:

# Each - is an input. Most options can be set at the input level, so
# you can use different inputs for various configurations.
# Below are the input specific configurations.

#- type: log

  # Change to true to enable this input configuration.
  #enabled: true

  # Paths that should be crawled and fetched. Glob based paths.
 # paths:
    #- /var/log/logstash/*.log
    #- c:\programdata\elasticsearch\logs\*

  # Exclude lines. A list of regular expressions to match. It drops the lines that are
  # matching any regular expression from the list.
  #exclude_lines: ['^DBG']

  # Include lines. A list of regular expressions to match. It exports the lines that are
  # matching any regular expression from the list.
  #include_lines: ['^ERR', '^WARN']

  # Exclude files. A list of regular expressions to match. Filebeat drops the files that
  # are matching any regular expression from the list. By default, no files are dropped.
  #exclude_files: ['.gz$']

  # Optional additional fields. These fields can be freely picked
  # to add additional information to the crawled log files for filtering
  #fields:
  #  level: debug
  #  review: 1

  ### Multiline options

  # Multiline can be used for log messages spanning multiple lines. This is common
  # for Java Stack Traces or C-Line Continuation

  # The regexp Pattern that has to be matched. The example pattern matches all lines starting with [
  multiline.pattern: ^\[

  # Defines if the pattern set under pattern should be negated or not. Default is false.
  multiline.negate: true

  # Match can be set to "after" or "before". It is used to define if lines should be append to a pattern
  # that was (not) matched before or after or as long as a pattern is not matched based on negate.
  # Note: After is the equivalent to previous and before is the equivalent to to next in Logstash
  multiline.match: after


#============================= Filebeat modules ===============================

filebeat.config.modules:
  # Glob pattern for configuration loading
  path: ${path.config}/modules.d/*.yml

  # Set to true to enable config reloading
  reload.enabled: false

  # Period on which files under path should be checked for changes
  #reload.period: 10s

#==================== Elasticsearch template setting ==========================

setup.template.settings:
  index.number_of_shards: 1
  #index.codec: best_compression
  #_source.enabled: false

#================================ General =====================================

# The name of the shipper that publishes the network data. It can be used to group
# all the transactions sent by a single shipper in the web interface.
#name:

# The tags of the shipper are included in their own field with each
# transaction published.
#tags: ["service-X", "web-tier"]

# Optional fields that you can specify to add additional information to the
# output.
#fields:
#  env: staging


#============================== Dashboards =====================================
# These settings control loading the sample dashboards to the Kibana index. Loading
# the dashboards is disabled by default and can be enabled either by setting the
# options here or by using the `setup` command.
setup.dashboards.enabled: true

# The URL from where to download the dashboards archive. By default this URL
# has a value which is computed based on the Beat name and version. For released
# versions, this URL points to the dashboard archive on the artifacts.elastic.co
# website.
#setup.dashboards.url:

#============================== Kibana =====================================

# Starting with Beats version 6.0.0, the dashboards are loaded via the Kibana API.
# This requires a Kibana endpoint configuration.
setup.kibana:

  # Kibana Host
  # Scheme and port can be left out and will be set to the default (http and 5601)
  # In case you specify and additional path, the scheme is required: http://localhost:5601/path
  # IPv6 addresses should always be defined as: https://[2001:db8::1]:5601
  host: "10.1.163.51:5601"

  # Kibana Space ID
  # ID of the Kibana Space into which the dashboards should be loaded. By default,
  # the Default Space will be used.
  space.id: "monitoring"

#============================= Elastic Cloud ==================================

# These settings simplify using Filebeat with the Elastic Cloud (https://cloud.elastic.co/).

# The cloud.id setting overwrites the `output.elasticsearch.hosts` and
# `setup.kibana.host` options.
# You can find the `cloud.id` in the Elastic Cloud web UI.
#cloud.id:

# The cloud.auth setting overwrites the `output.elasticsearch.username` and
# `output.elasticsearch.password` settings. The format is `<user>:<pass>`.
#cloud.auth:

#================================ Outputs =====================================

# Configure what output to use when sending the data collected by the beat.

#-------------------------- Elasticsearch output ------------------------------
output.elasticsearch:
  # Array of hosts to connect to.
  hosts: "sag-prd-es-002.sag.services:9200"

  # Protocol - either `http` (default) or `https`.
  #protocol: "https"

  # Authentication credentials - either API key or username/password.
  #api_key: "id:api_key"
  username: "elastic"
  password: "elastic"

#----------------------------- Logstash output --------------------------------
#output.logstash:
  # The Logstash hosts
  #hosts: ["localhost:5044"]

  # Optional SSL. By default is off.
  # List of root certificates for HTTPS server verifications
  #ssl.certificate_authorities: ["/etc/pki/root/ca.pem"]

  # Certificate for SSL client authentication
  #ssl.certificate: "/etc/pki/client/cert.pem"

  # Client Certificate Key
  #ssl.key: "/etc/pki/client/cert.key"

#================================ Processors =====================================

# Configure processors to enhance or manipulate events generated by the beat.

processors:
  - add_host_metadata: ~
  - add_cloud_metadata: ~
  - add_docker_metadata: ~
  - add_kubernetes_metadata: ~

#================================ Logging =====================================

# Sets log level. The default log level is info.
# Available log levels are: error, warning, info, debug
#logging.level: debug

# At debug level, you can selectively enable logging only for some components.
# To enable all selectors use ["*"]. Examples of other selectors are "beat",
# "publish", "service".
#logging.selectors: ["*"]

#============================== X-Pack Monitoring ===============================
# filebeat can export internal metrics to a central Elasticsearch monitoring
# cluster.  This requires xpack monitoring to be enabled in Elasticsearch.  The
# reporting is disabled by default.

# Set to true to enable the monitoring reporter.
#monitoring.enabled: false

# Sets the UUID of the Elasticsearch cluster under which monitoring data for this
# Filebeat instance will appear in the Stack Monitoring UI. If output.elasticsearch
# is enabled, the UUID is derived from the Elasticsearch cluster referenced by output.elasticsearch.
#monitoring.cluster_uuid:

# Uncomment to send the metrics to Elasticsearch. Most settings from the
# Elasticsearch output are accepted here as well.
# Note that the settings should point to your Elasticsearch *monitoring* cluster.
# Any setting that is not set is automatically inherited from the Elasticsearch
# output configuration, so if you have the Elasticsearch output configured such
# that it is pointing to your Elasticsearch monitoring cluster, you can simply
# uncomment the following line.
#monitoring.elasticsearch:

#================================= Migration ==================================

# This allows to enable 6.7 migration aliases
#migration.6_to_7.enabled: true
Is it possible that the gork parse failure occurs because of a bug in the filebeat version?
Or am i doing something wrong again in the configuration files?
Some are supposed to be parsed correctly and as you see in the following pic they dont have the grok failure message. Nevertheless, the message field is not parsed correctly i believe because it doesnt even contain the date in the beggining as all logs do:
Concerning the copying of files ,Yes ofcourse i provide the following:
[2020-05-15T07:32:49,280][WARN ][org.logstash.plugins.pipeline.PipelineBus][metricbeat-in] Attempted to send event to 'metricbeat-autostore' but that address was unavailable. Maybe the destination pipeline is down or stopping? Will Retry.
[2020-05-15T07:37:58,888][DEBUG][org.logstash.beats.BeatsHandler][filebeat-in] [local: 10.1.163.51:5044, remote: 10.1.161.156:49740] Sending a new message for the listener, sequence: 433
[2020-05-15T07:37:58,887][DEBUG][logstash.filters.mutate ][filebeat-lasernet] filters/LogStash::Filters::Mutate: removing field {:field=>"TMP"}
I have been doing some tests and these logs cannot be parsed in 7.6.2, but they can be parsed with 7.7.0. I have seen that there have been many changes in this module in 7.7.0, I think your issue could be solved in this version, would you have the chance to try to upgrade filebeat?
Regarding the lack of the log.level field in this Kibana view, this field is only going to appear on events that are correctly parsed, I see in your screenshot that the event is one that couldn't be parsed. Could you check with an event that is correctly parsed?
-I can try to install filebeat version 7.7.0 but is it ok if my elastic cluster is still on version 7.6.2 ???
-Well i see the log.level here for example but still i dont believe it parses it correctly because if you see the message field it doesnt even contain the log timestamp:
It is usually not recommended, but just in case you want to give a try, I think it should work for your case.
This is expected, the timestamp found in the parsed log is used as timestamp for the event. The message field contains only the message, without the timestamp, the log level and so on.
Apache, Apache Lucene, Apache Hadoop, Hadoop, HDFS and the yellow elephant
logo are trademarks of the
Apache Software Foundation
in the United States and/or other countries.