Hello
I have the following case that I could not solve.
I have 2 Logstash that fetch data from a database, where each one transmits a field called "codigosap" that has the following form: J520 or N776 for example. It is an identifier. In addition other types of fields are transmitted.
Then in kibana I have a dashboard which shows graphs of the two Logstash.
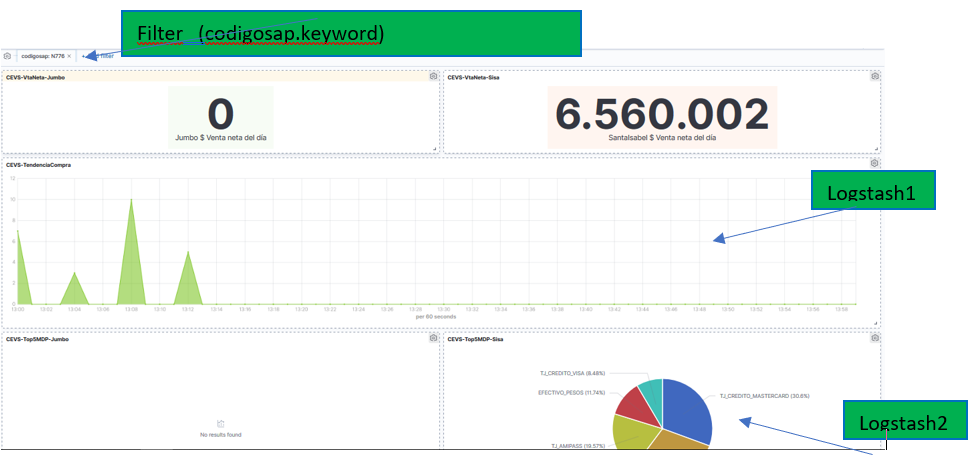
The problem I have is that at the moment of filtering, I click on a graph and I see all the data referring to the Jxxx identifier which is seen in the filters that is applied as "codigosap.keyword" with this all ok. However when I filter by sap Nxxx code I can't see all the data in all the graphics. I attach an example image.

If I click any JXXX, so in this example it is filtered by J512, and that is OK
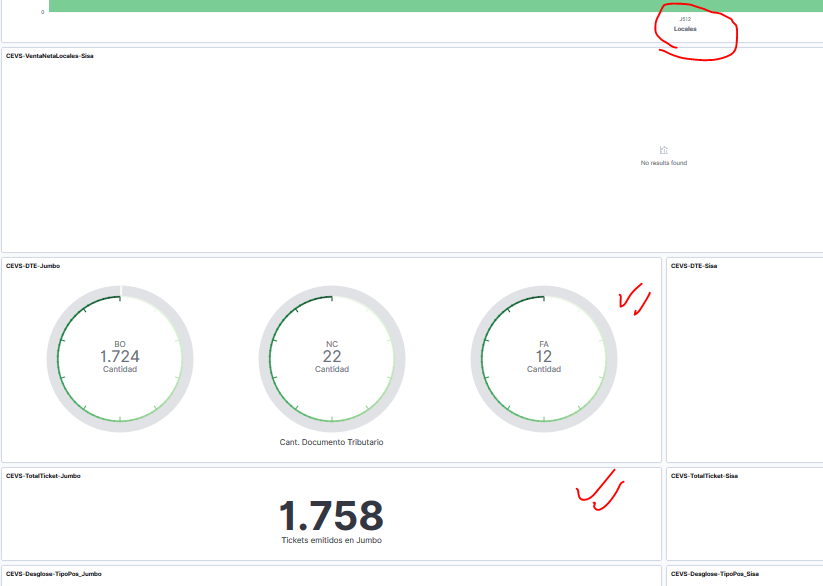
but, in the same dashboard, when I want to filter by an N776 codigosap.keyword, I don't get results in the dashboard

I do not understand what I am missing since the data is in the same format from the source that is the database, char (4).
for example, in a visualization that, filter the data with:
{
"query": {
"prefix": {
"codigosap.keyword": "J"
}
}
}
this way I get only the codigosaps that start with J. When I want to get the ones that start with N, I just apply the inverse of the filter:

the problem occurs when I filter on the main dashboard
this is when it works for the J codigosap

when i apply for codigosap N, it doesn't work to show the data of the 2 logstash

but if I modify the filter for this case, and I modify it to: codigosap (no keyword, then it works)
{
"query": {
"match": {
"codigosap": {
"query": "N776",
"type": "phrase"
}
}
}
}