How can I found the script/query behind a table (Kibana 5).
For an example in this table:

I want to see the query on how to get the field of hits.total (that is equal to 96)
Hi @tomer,
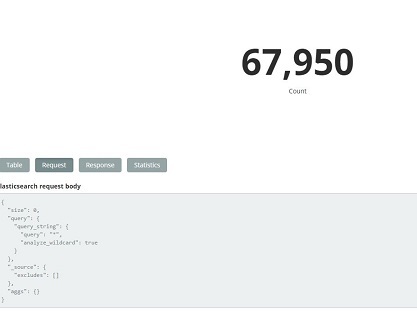
on every visualization there is a small arrow at the bottom:
Upon clicking that arrow, Kibana will show various textual information about the visualization including the query used to fetch the displayed data:
Thanks this will save me a lot of time!!
Hello @weltenwort,
How to enable this option "Debug" in any type of visualization? there is no this feature in my Kibana (Version: 5.2.2) 

I was taking the screenshot while running Kibana in development mode (with --dev). The "Debug" panel displays some internals about the visualization useful for debugging during development.
Thanks for reply,
So can you change the requst in the debug window?
For example I want to change colors and other atributes, but in Request there are no thise features.
Can you please describe more about Debug, or doc. Thanks you very much.
The "Debug" window just displays some internal values of the visualization configuration for debugging during developent. In order to change the color associated with a bucket, just click a legend entry on the right to open a color picker. The configurable attributes of each visualization type are described in the documentation.
© 2020. All Rights Reserved - Elasticsearch
Apache, Apache Lucene, Apache Hadoop, Hadoop, HDFS and the yellow elephant logo are trademarks of the Apache Software Foundation in the United States and/or other countries.

