Hi,
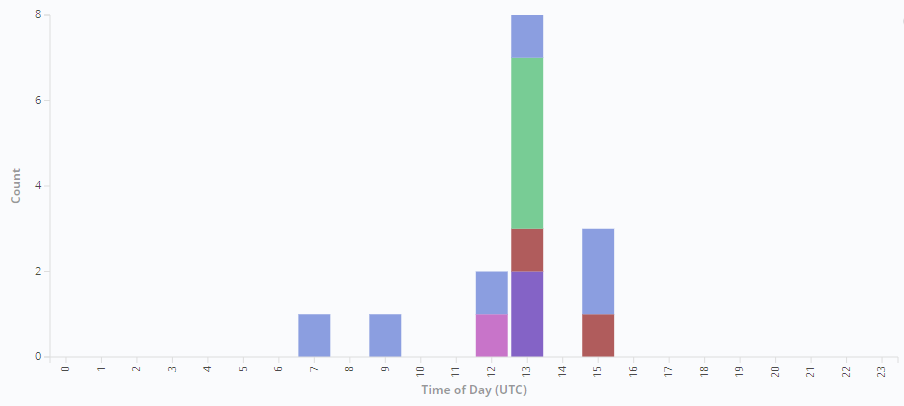
I am trying to format the x-axis tick labels. I have a histogram that counts documents according to hour of day (0 to 23). On the visualization I want the x-axis ticks to be 0:00, 1:00 ... 23:00. How can I achieve this? (Using Kibana 6.8 and 7.5)
This topic was automatically closed 28 days after the last reply. New replies are no longer allowed.