Dear All,
We have index that holds the number of orders sent to use by users . Each order holds the Latency value which confirms how long system took to process this order . The latency values Can range from (0.01 ms to 200 ms (ms is in millisecond ) .
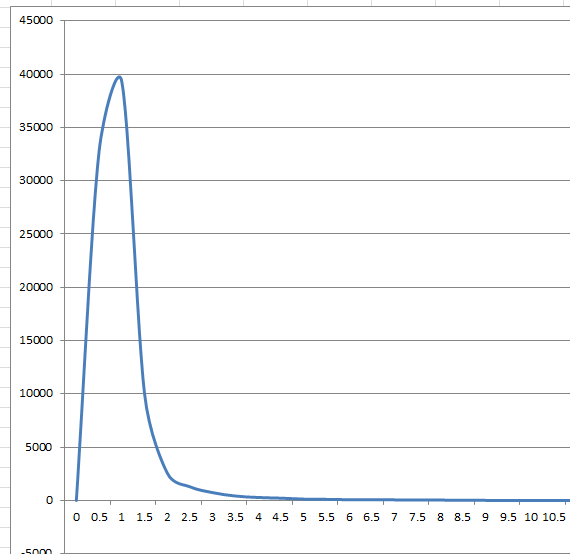
We are interested plotting the frequency distribution graph in Kibana using ELK which shows the number of orders in different latency interval for example latency range can be (0ms to 5 ms , 5ms- 10ms , 10ms-15ms up to 195ms to 200ms) .
I am trying to achieve this using Histogram aggregation but each time I run the aggregation it breaks Elasticsearch and all shard goes to Red. Only solution is then to reboot the eLK server .
Just wondering if there is any way I can achieve the above request .
Thanks in Advance .
Regards
ali

