hi
During busy hours of Day, heap usage of some of nodes in Es cluster began to raise and old gc was more frequency. Full gc was also triggered and last about 20-40 seconds.
old gc times:
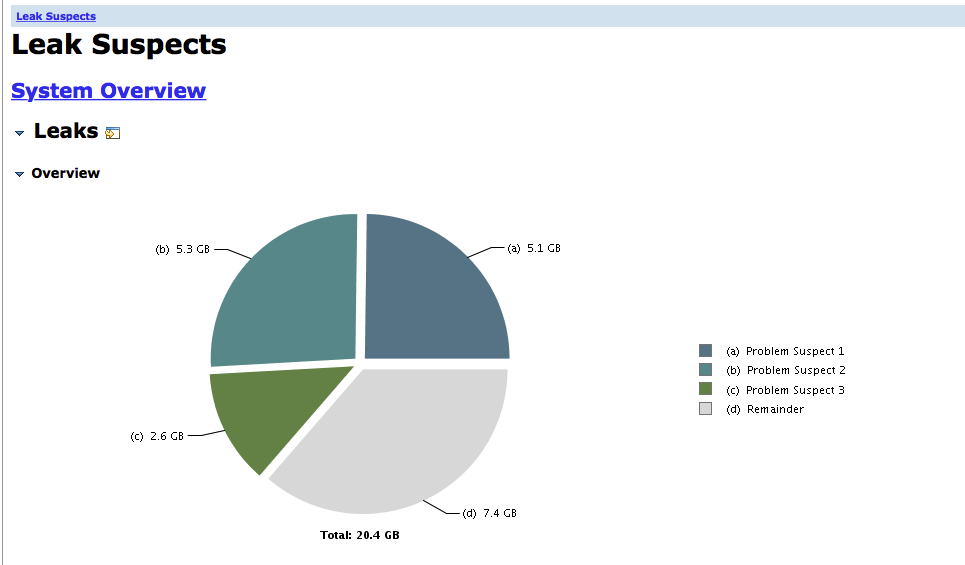
Only If I reduce index rate, the heap usage was back to normal. I made a dump of heap and used MAT to do Leak Suspects.
Es Cluster Info:
Es version 5.4.3
3 * master node, 26 hot node, 52 code node.
Only one hot node and 3 code node meet gc frequency problem at the same time.
Is there any anomaly according to the Leak Suspects reports? I will provide more info if needed.
Not sure it will solve your current problem but what about upgrading to the latest 5.x version which contains a lot of bug fixes?
Even better, upgrade to 6.x or better than better, upgrade to 7.0?
What is the output of:
GET /_cat/health?v
GET /_cat/indices?v
GET /_cat/shards?v
Thanks @dadoonet
During problem time, this cluster is in Green state and also there is no shard relocation.
Doing elasticsearch version update is a huge task for us at this moment. We have 6 Es clusters and use tribe node as proxy. So we have to update all clusters.
Only one cluster meet gc problem recently and the index load of this cluster is not very high in my opinion.
Do you think that it is some bug of 5.4.3 ES caused this gc problem?
Is this issue related to the same cluster discussed in this thread? If so, how much data do you have in the cluster? Have you followed the guidelines laid out in this webinar? It also seems like you have a quite high index and shard count, which could be contributing to heap pressure. Please see this blog post for some practical guidelines.
This issus is not related to this thread
The ES cluster INFO:
Es version 5.4.3
3 * master node, 26 * hot node, 52 * code node.
each node has 31GB heap.
2,910 indices 6,518 shards
Thanks for sharing.
It looks like you have plenty of small shards. May be something you should consider.
Some shards are overloaded IMO. Like
billions-video.vod.playurl-@2019.05.09-jssz03-1	1	p	STARTED	89054241	131.2gb	10.69.175.31	jssz-billions-es-55-datanode_hot
billions-video.vod.playurl-@2019.05.09-jssz03-1	0	p	STARTED	89083881	131.2gb	10.69.175.32	jssz-billions-es-56-datanode_hot
billions-video.vod.playurl-@2019.05.09-jssz03-1	5	p	STARTED	88789888	131.3gb	10.69.67.14	jssz-billions-es-19-datanode_hot
billions-video.vod.playurl-@2019.05.09-jssz03-1	2	p	STARTED	88941625	133.4gb	10.69.34.17	jssz-billions-es-40-datanode_hot
billions-video.vod.playurl-@2019.05.09-jssz03-1	9	p	STARTED	88851385	133.5gb	10.69.67.20	jssz-billions-es-28-datanode_hot
billions-video.vod.playurl-@2019.05.09-jssz03-1	8	p	STARTED	89018956	133.8gb	10.69.67.18	jssz-billions-es-26-datanode_hot
We recommend no more than 50gb per shard.
Not sure if you are using rollover API but I'd use it in your case to reduce the number of shards and try to keep them around 50gb per shard.
The total number of shards/indices you have in your cluster has also the consequence I think of a very big cluster state. Those big "objects" needs to be Gc'ed sometime. Because you have a very big HEAP (31gb), the old GC can take several minutes sadly.
My opinion is that you should consider at some point to upgrade elasticsearch and your JVM. In 7.x you will have a more recent JVM which different GC algorithms.
Thanks for your reply.
I think "big cluster state" maybe is not the case of gc problem. I have another cluster ( B for short)which is the same size(hardware size) as this cluster( A for short) with gc problem. Cluster B has 13,508 indices and 21,615 shards as much as twice of cluster A. Index load of Cluster B is also larger then Cluster A. But cluster B never met the gc problem.
According to the leak suspect report, this suspect is very suspicious.
Apache, Apache Lucene, Apache Hadoop, Hadoop, HDFS and the yellow elephant
logo are trademarks of the
Apache Software Foundation
in the United States and/or other countries.