Full disk access was not enabled before, and an error will be displayed on the fleet side

Now that full disk access is not enabled, no errors are displayed on the fleet side?
Based on the second screenshot, I think you may be encountering a different problem.
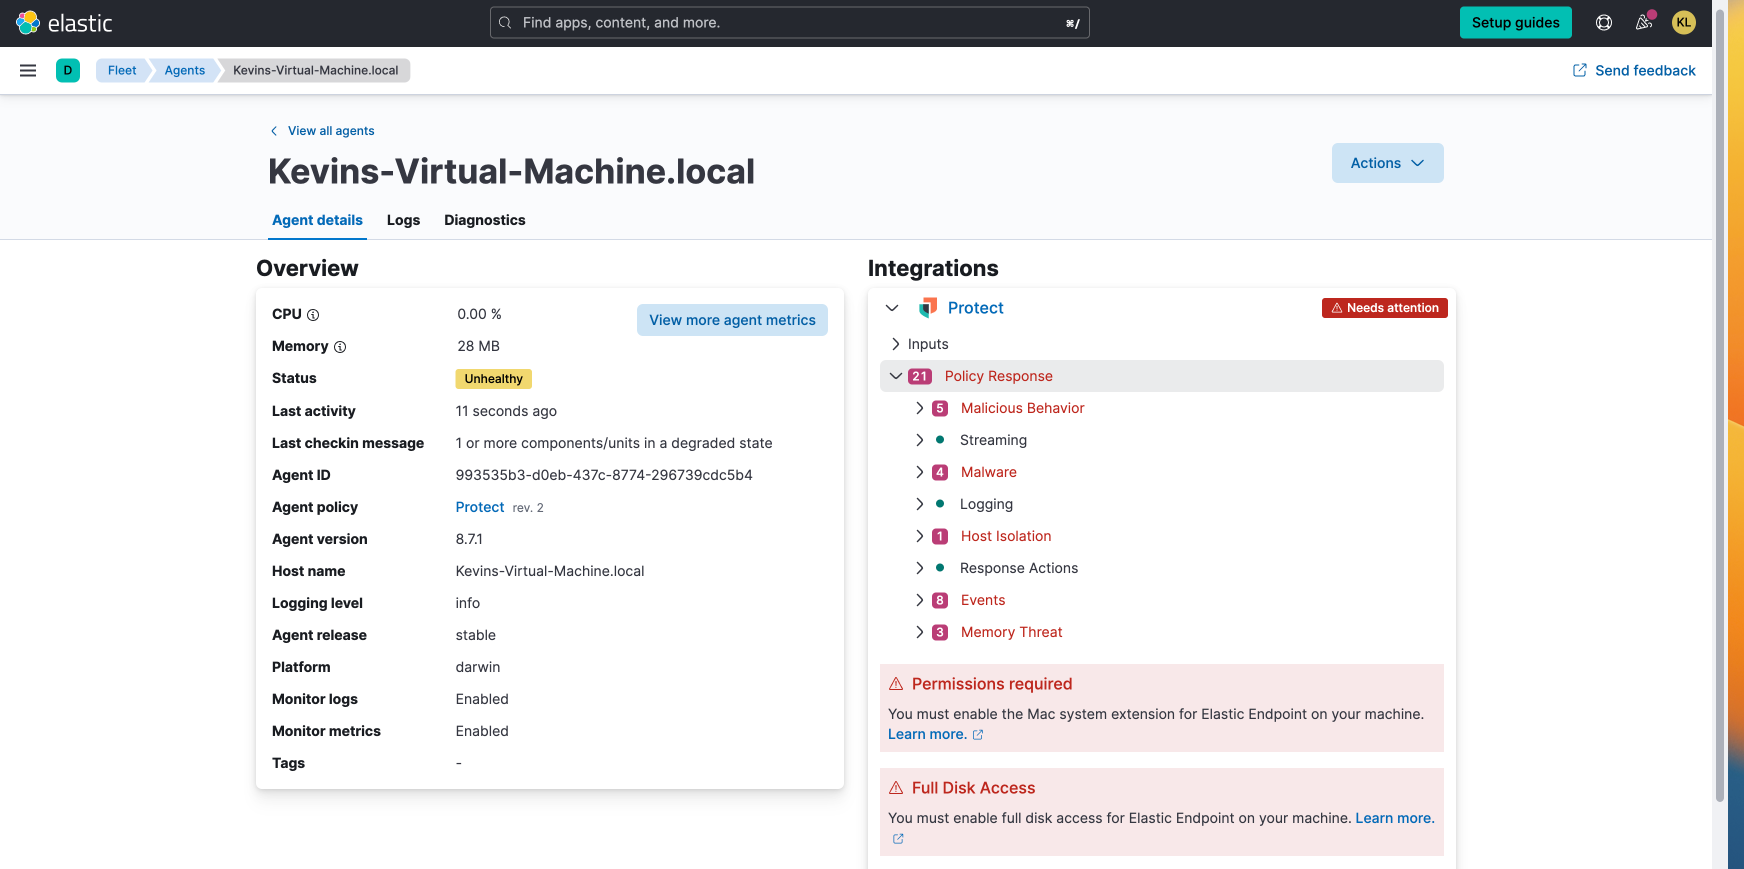
In the first one, Endpoint is communicating with the stack and has sent a policy response indicating that the full disk access is not enabled on the host.
In the second one, it looks like Endpoint isn't communicating with the stack at all, which is why there is no Policy response and also no error about full disk access.
Can you confirm that the Endpoint is running on your host? After, can you confirm that the Endpoint is streaming data?
A quick way to do this in the UI is to go to the Hosts page in security, url: https://<kibana-url>:<port>/app/security/hosts/, and filter by agent.type : "endpoint" and host.hostname : "YOUR-HOSTNAME"
You should see a steady stream of event coming in the Events tab. There's an example below.
Some followup questions:
Thank you for your answer.
1, The stack version is 8.7.1.
2, agent upgrade is also a problem, because full disk access is not enabled
3, enabling full disk access can make the agent become normal and healthy
4, the main difference is that full disk access is not enabled, no error reporting is shown, and part of the agent status is still healthy, so that the client will not know if the configuration is done correctly, and if full disk access is not enabled, the logs will be incomplete.
@xqaiviwjxzw thanks for the details.
I wanted to see if I could reproduce a bug so I stood up an 8.7.1 stack and connected a Mac endpoint without Full Disk Access and was able to see the errors as expected.
So far, I haven't been able to reproduce the issue, so I'll ask questions below to try to see if I can reproduce the issue as you are seeing it.
When in this state, it can take a few minutes for Endpoint to report the status to the stack. Did you ever see a Full Disk Access error come up after some time?
I can see your first screenshot that it says "No Policy Response Available". If this remains, it makes me think that your Endpoint is not communicating with the stack at all, which would explain why you are not getting any errors or Policy response. If this is the case, I would do a check to see if your Endpoint is streaming events as laid out in my first post.
Additional followup questions so that I can try to see if there is a bug in some workflow.
Which workflows did you perform between your first screenshot where you see the correct Full Disk Access errors and the second screenshot where you do not see the errors? Did you perform a stack upgrade in between? Did you perform an Agent upgrade in between? If I can follow the same steps you took, I can give more insight on what might be wrong
Do you have multiple Mac endpoints on your stack that are showing this same behavior? Are all Mac Endpoints without Full Disk Access NOT reporting the error? Or is it just a few?
thank you for your reply. The agent 8.4.1 I use does not enable full disk access, and there is no error displayed in the fleet part.
For the 8.4.1 Endpoint, do you always see the "No Policy Response" message similar to your screenshot below?
If this is the case, I don't think this is a problem of the full disk access error reporting, I think it's because either the Endpoint itself never installed correctly or it is not communicating properly with the stack.
Can you provide the Endpoint logs? This will give us better insight.
On Mac, they are located at /Library/Elastic/Endpoint/state/log. You will see the log files here. If Endpoint is working properly, you should see plenty of logs that look like the below which signifies that it's streaming docs to ES.
{"@timestamp":"2023-05-11T18:30:28.404039895Z","agent":{"id":"116723be-9e12-46cc-92af-e1127de8de30","type":"endpoint"},"ecs":{"version":"1.11.0"},"log":{"level":"info","origin":{"file":{"line":265,"name":"BulkQueueConsumer.cpp"}}},"message":"BulkQueueConsumer.cpp:265 Sent 223 documents to Elasticsearch","process":{"pid":17339,"thread":{"id":17346}}}
You should also see logs that say the System Extension failed similar to the below.
{"@timestamp":"2023-05-11T11:47:03.876425Z","agent":{"id":"","type":"endpoint"},"ecs":{"version":"1.11.0"},"log":{"level":"info","origin":{"file":{"line":304,"name":"SystemExtensionComms.mm"}}},"message":"SystemExtensionComms.mm:304 Failed to configure system extension","process":{"pid":883,"thread":{"id":8298}}}
{"@timestamp":"2023-05-11T11:47:03.884719Z","agent":{"id":"","type":"endpoint"},"ecs":{"version":"1.11.0"},"log":{"level":"info","origin":{"file":{"line":236,"name":"SystemExtensionComms.mm"}}},"message":"SystemExtensionComms.mm:236 Registration with system extension failed","process":{"pid":883,"thread":{"id":8336}}}
I am happy to take a closer look at your logs myself if you are OK with it. You can compress /Library/Elastic/Endpoint/state/log and send it along. Feel free to send a personal message to me if you'd rather not put it in the forum.
© 2020. All Rights Reserved - Elasticsearch
Apache, Apache Lucene, Apache Hadoop, Hadoop, HDFS and the yellow elephant logo are trademarks of the Apache Software Foundation in the United States and/or other countries.