@warkolm Please let me know whether any further logs are required to debug this?
@warkolm @devon.thomson there is one more flavor to these errors. Please see if this is relevant.

I just chatted with @JLeysens on the Core team, and he thinks that some other error is actually being thrown, and just mapped to a 404. JL said "Not sure about their setup, but it seems like Kibana is being starved for resources on the host". The gateway time-out error you are seeing seems to confirm this.

@warkolm @devon.thomson please suggest whether any changes are required.
Could it be because we are using single instance of elastic?
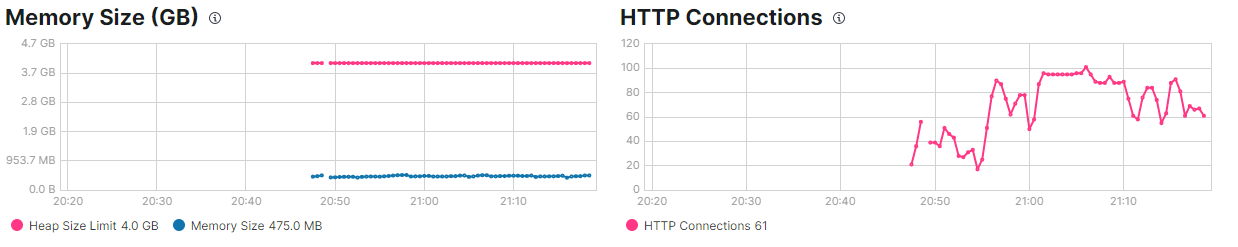
Your host seems to be under pressure, you don't have much free memory and you have a huge amount of CPU use. I would be looking at why that is.