FROM data
  | EVAL month_of_year = DATE_EXTRACT("month_of_year", date), hour_of_day = DATE_EXTRACT("HOUR_OF_DAY", date)
  | STATS AVG(value) BY month_of_year, hour_of_day
  | SORT hour_of_day ASC, month_of_year ASC
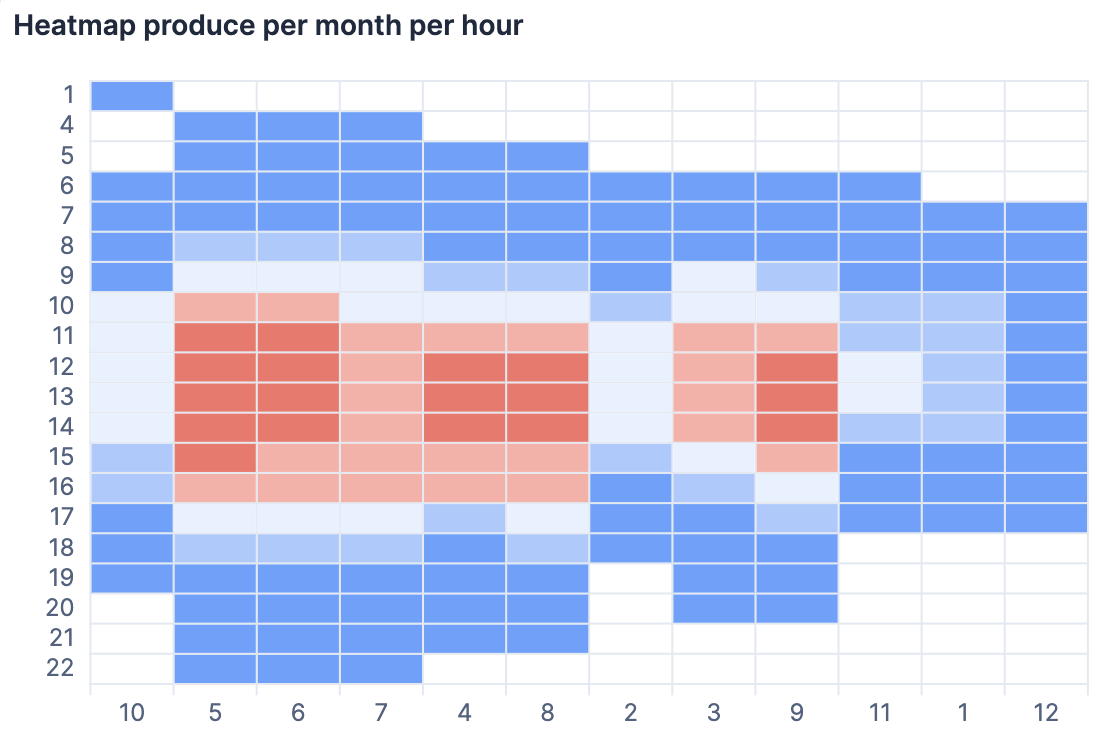
As this data is sorted correctly on two dimension in the ESQL response I would have expected proper sorting in my heatmap visualization as well. However the graph looks like this:
As you can see, the sorting of the x-axis (month of year) is completely random. If I change the sort order from SORT hour_of_day ASC, month_of_year ASC to SORT month_of_year ASC, hour_of_day ASC then the hour is mixed up randomly.
Am I missing any special option on the graph configuration? Happy to get any hints
As per documentation could it be a case where the month_of_year ASC has NULL records because of which it is sorted last ?
The SORT processing command sorts a table on one or more columns.

The default sort order is ascending. Use ASC or DESC to specify an explicit sort order.

Two rows with the same sort key are considered equal. You can provide additional sort expressions to act as tie breakers.

Sorting on multivalued columns uses the lowest value when sorting ascending and the highest value when sorting descending.

By default, null values are treated as being larger than any other value. With an ascending sort order, null values are sorted last, and with a descending sort order, null values are sorted first. You can change that by providing NULLS FIRST or NULLS LAST.
Apache, Apache Lucene, Apache Hadoop, Hadoop, HDFS and the yellow elephant
logo are trademarks of the
Apache Software Foundation
in the United States and/or other countries.