Hi,
on one of our test-systems we ran into an OutOfMemory situation that required a full restart of both instances to get up again.
We have heapdumps enabled and are trying to analyze what caused this instead of triggering a breaker.
Elasticsearch 2.3.5, 2 instances, 4GB OS RAM, 2GB allocated for ES
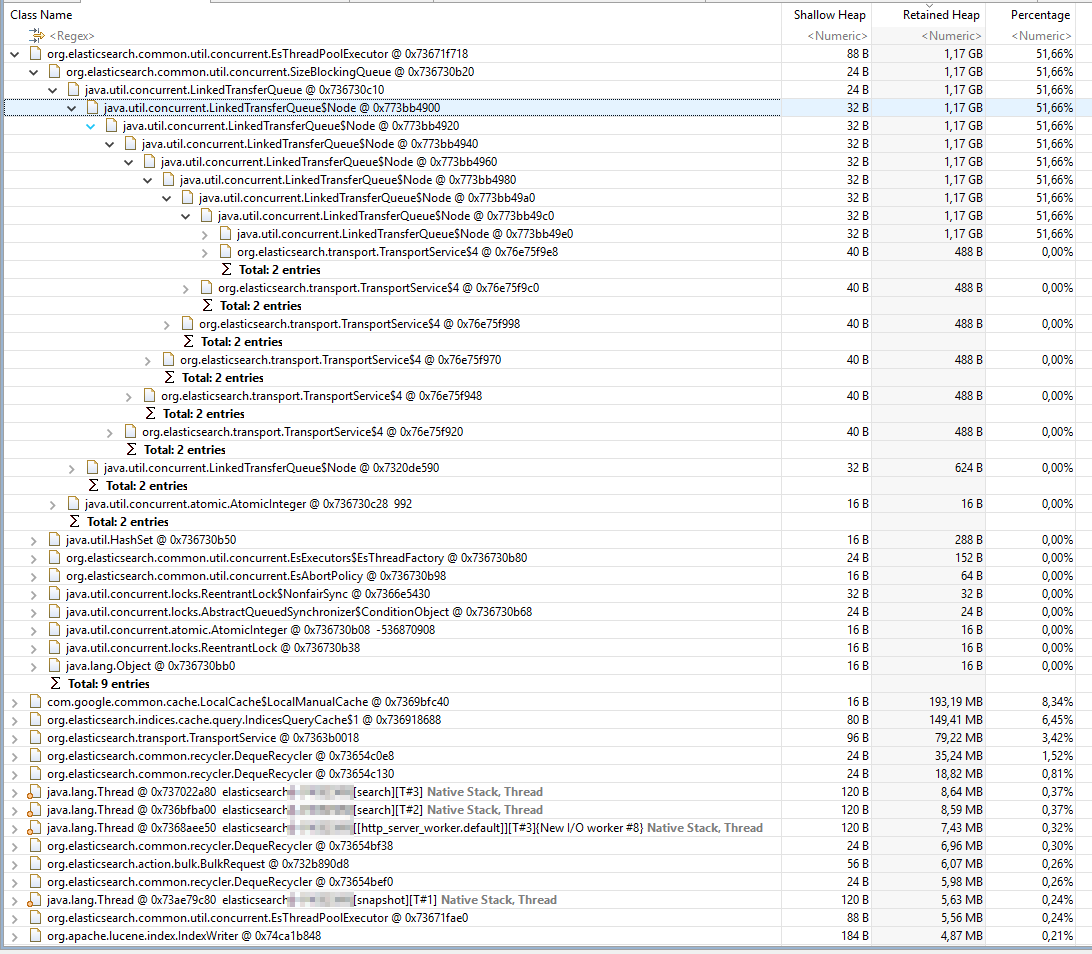
When looking at the heapdump I see that a lot of data is kept in one of the tasks, there are already >900 tasks, likely because work was queuing up.
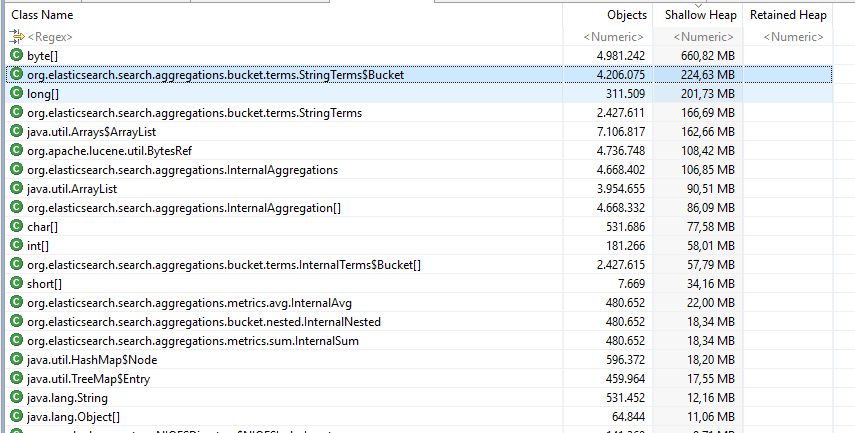
The histogram shows many Buckets being allocated
Following from there to the root-object shows the following link-chain
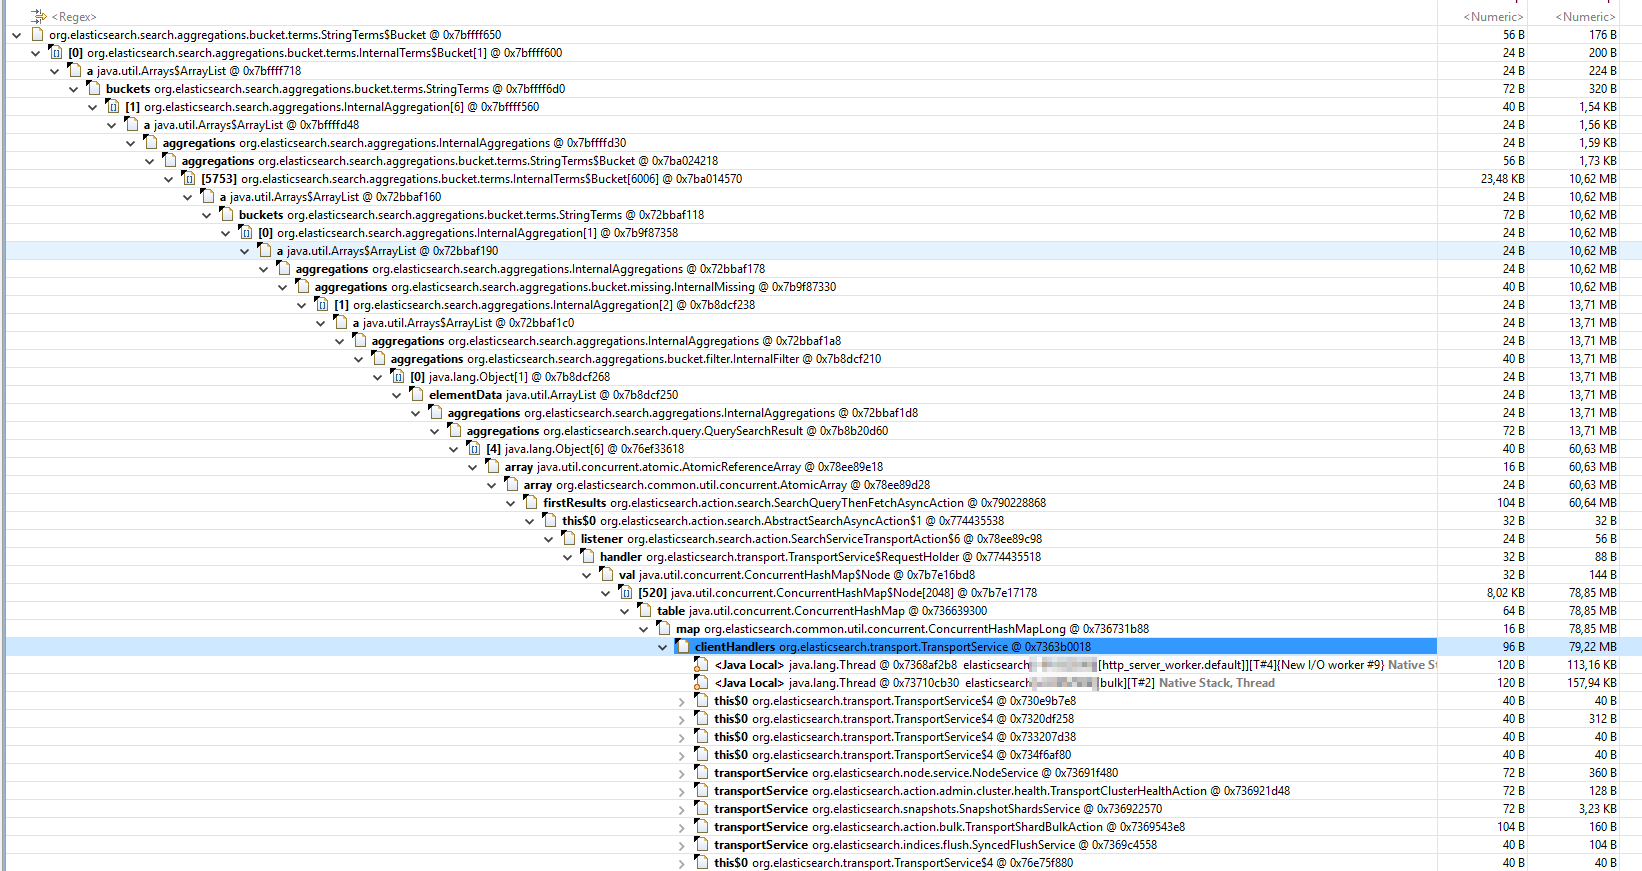
So it seems some complex query with aggregations killed memory.
Is there some breaker that should catch this?
Or is there some setting to limit the query to not overwhelm the instances when an aggregation allocates a large number of buckets?