Hi everyone. I am trying to create a data table based on the sample logstash indeces provided here. I want the table to follow the following format:
Term/Keyword | # Total | # 200 (response) | # 404 (response) | # 503 (response)
IP Address (IP)
jpg (extension)
css (extension)
png (extension)
gif (extension)
php (extension)
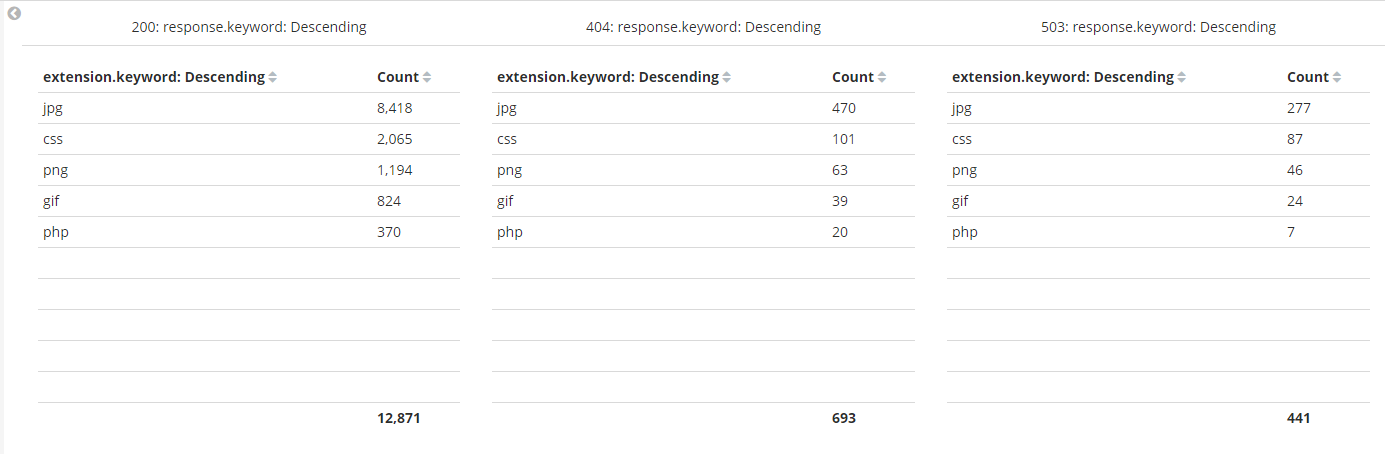
Basically, I want to get total count of IP addresses across all events and the total count of each extension across all events. In addition, I want the same breakdown filtered on each response keyword.
I'm close (please see the attached screenshots), but I want it to match the format I outlined above.
Any help would be greatly appreciated!