Hi everyone,
I'm encountering an issue with Elasticsearch and would greatly appreciate some assistance.
Background Information:
Elasticsearch Version: 7.15.2
Problem Description:
I've been experiencing memory management issues with my Elasticsearch instance. To diagnose the problem, I used the Memory Analyzer tool.
Steps to Reproduce:
/usr/share/elasticsearch-7.15.2/jdk/bin/jmap -dump:format=b,file=/mnt/heap.hprof $(pgrep java)
Memory Analyzer Results:
I have run the Memory Analyzer and identified some potential memory leaks. However, I'm having difficulty interpreting the results and pinpointing the exact causes of these leaks.
Screenshots:

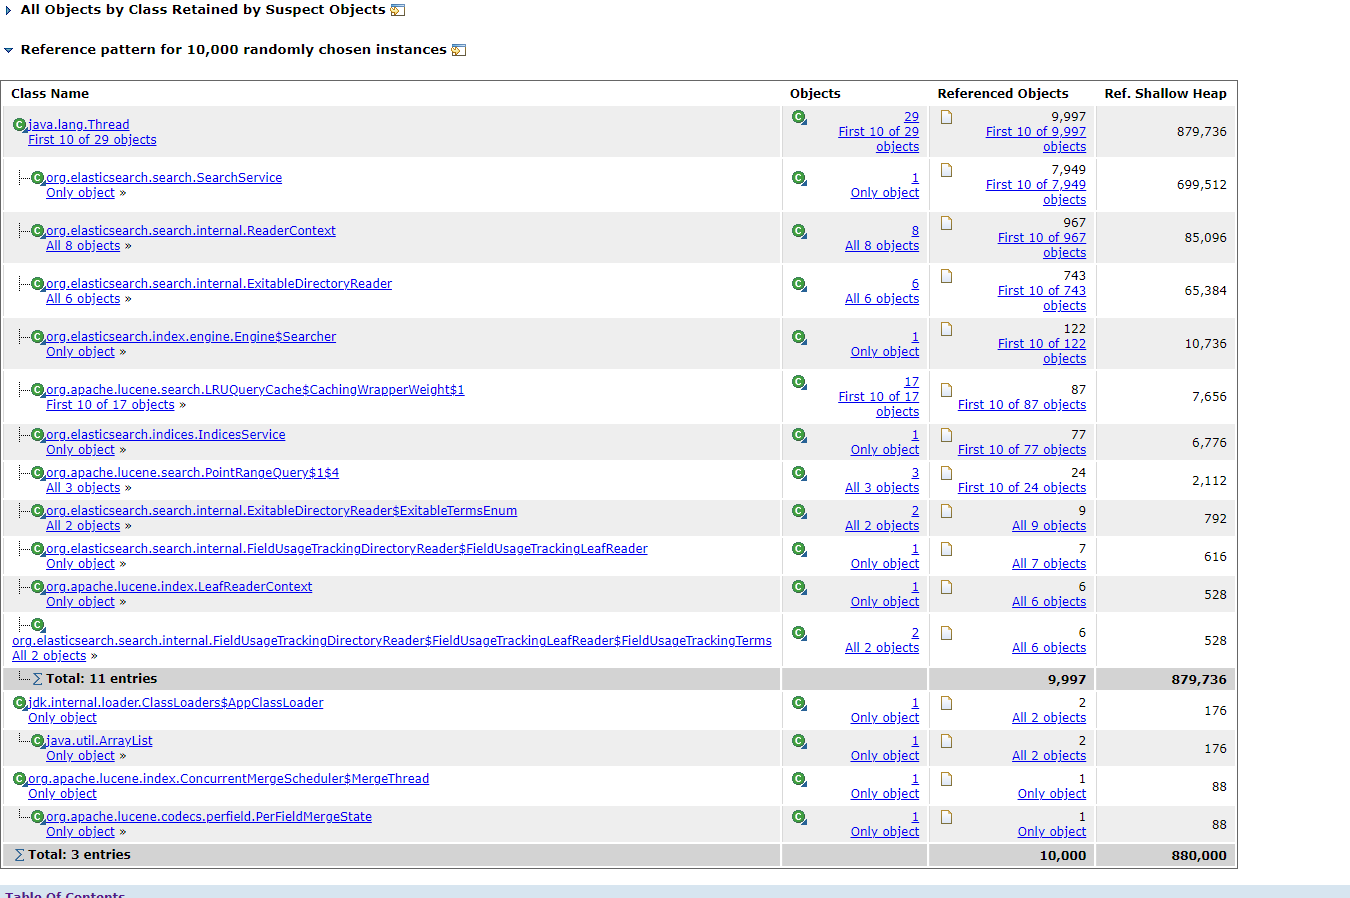


I've attached screenshots of the Memory Analyzer results for reference.
Request for Assistance:
Could someone please guide me on how to interpret these results and identify the memory leak points? Any insights or suggestions would be highly appreciated.
Thank you in advance for your help!