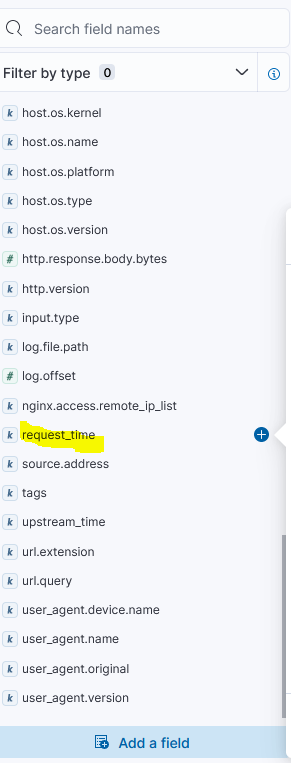
Yes thank @stephenb . Yesterday I also think a lot of about how to integrate responsetime field in nginx , elastic-agent . And I have any suggestion solution to solve this problem as follow step:
Step 1 : I access with path on Kibana: Stack Management -> Ingest Pipelines -> logs-nginx.access-1.11.0.
Step 2: Double click edit tab logs-nginx.access-1.11.0.: . Go click Dupicate this prossessor for clone tab Grok
Apache, Apache Lucene, Apache Hadoop, Hadoop, HDFS and the yellow elephant
logo are trademarks of the
Apache Software Foundation
in the United States and/or other countries.