Is it possible to add 9 hours manually to hourly line graph?
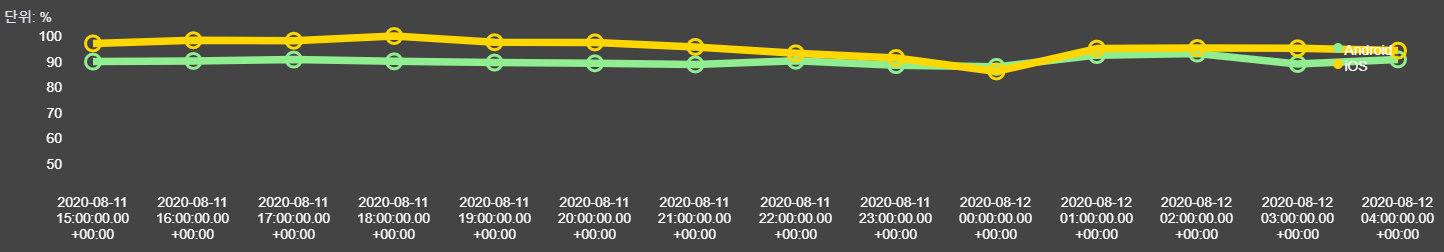
Definitely, I'm drawing Today's hourly success-rate for specific action.
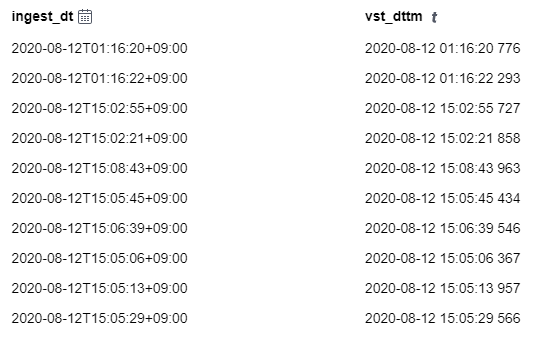
So, I set up the timeFilter "Today" and add "1h" interval condition my timelion query.
I want to make line graph starting with "2020-08-12 00" on x-axis but my graph start with "2020-08-11 15". Is there anyone who can help me add 9 hours to each date on X-axis?
Do you want to do this because you want to show the chart in your local timezone? If yes, then you should be able to just omit the mapColumn function in your expression turning the @timestmp column into a formatted string. When you pass the date directly to the chart, it will use the local timezone of your browser and apply a nice formatting by default.
Apache, Apache Lucene, Apache Hadoop, Hadoop, HDFS and the yellow elephant
logo are trademarks of the
Apache Software Foundation
in the United States and/or other countries.